This blog will talk about what is chord diagram, its usage and about how to create and integrate a D3 Chord Diagram in Jaspersoft / iReport
All the reports are develop using ireport 5.5 professional and jasper server 5.5
As html component of jasper server does not load any scripts in the html component, we loaded the script in one of the decorator page(jsp page). The page is located at the location:
C:\Jaspersoft\jasperreports-server-5.5\apache-tomcat\webapps\jasperserver-pro\WEB-INF\decorators\decorator.jsp
* Note: The above problem is specific with Jaspersoft 5.5 and not with the previous versions.
In the page we included the scripts which we want to load. We added the following code in the jsp page at line no 46:
<script type=”text/javascript” language=”JavaScript” src=”${pageContext.request.contextPath}/scripts/d3.v3.min.js”></script>
The script to be added should be kept at location:
C:\Jaspersoft\jasperreports-server-5.5\apache-tomcat\webapps\jasperserver-pro\scripts
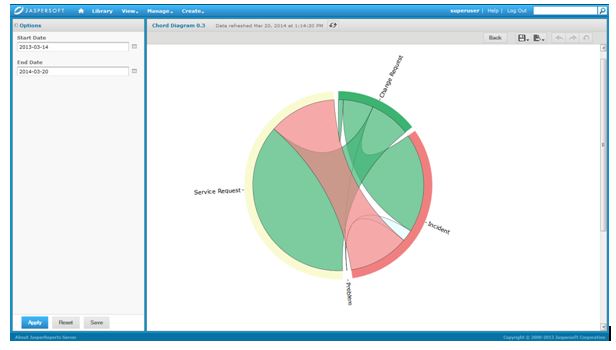
Chord Diagram:
Chord diagram is basically used to show the relation between multiple entities. Different entities are represented by different arcs, the size of the arc varies. Also these different arcs are connected to each other via chords or ribbons, which shows the relationship strength between them. There can also be hover information, colors on the arcs or relationships (ribbons) etc.
Chord diagrams in D3 are one of the more difficult chart types to produce from raw data. Fundamentally, you have to construct both a matrix and a mapping that explains how the matrix is composed and contains other meta data in order to render a complete diagram with appropriate coloring and labels.
Chord diagrams in D3 present information using two sets of the SVG elements: (1) a set of arcs around the outside of the diagram and (2) a set of chords or ribbons on the inside. The arcs are referred to as “groups” in the D3 code and their arc length (how much of the circle they occupy) is determined by aggregating one complete row of the matrix. Thus, the circumference of the circle represents the sum of the entire matrix (in whatever units it is expressed in) and is sub-divided into arcs for each of its rows. The chords on the other hand show relations between elements in the matrix. Their width on either end is determined by a location in the matrix.
A chord always has a “source” and a “target” and the way those are interpreted depends on your data.
Integration with JasperServer:
The data which we use for developing the chord diagram can be fetched from any database. The data fetched from database is stored in a variable and is then accessed in the html component using the same variable. Applying this process makes the report dynamic instead of static. Few parameters can also be added in the report which can be used in query and/or html component.
We require a matrix for creating a chord diagram. So data can be stored in a variable of string type and when used in the script it is first converted to array of array and is then used in the chord diagram.
Any variable/parameter can be accessed as shown below:
“<script> var arr =”+$V{variable1}+” </script>”
Parameter in query:
Select * from table_name
where date between $P{parameter1} and $P{parameter2}
The sample code of static chart can be found at:
http://bl.ocks.org/mbostock/4062006
The steps on how to integrate it with jasperserver was discussed in my previous blog(D3 Integrating with Jasperserver).
Please refer to the link
http://helicaltech.com/d3-integration-jaspersoft-ireport-jasper-server/

Best Open Source Business Intelligence Software Helical Insight is Here