This blog will talk about what is calendar view chart, its usage and about how to create and integrate a D3 Calendar View Chart in Jaspersoft / iReport
Make data easy with Helical Insight.
Helical Insight is the world’s best open source business intelligence tool.
All the reports are develop using ireport 5.5 professional and jasper server 5.5
As html component of jasper server does not load any scripts in the html component, we loaded the script in one of the decorator page(jsp page). The page is located at the location:
C:\Jaspersoft\jasperreports-server-5.5\apache-tomcat\webapps\jasperserver-pro\WEB-INF\decorators\decorator.jsp
* Note: The above problem is specific with Jaspersoft 5.5 and not with the previous versions.
In the page we included the scripts which we want to load. We added the following code in the jsp page at line no 46:
<script type=”text/javascript” language=”JavaScript” src=”${pageContext.request.contextPath}/scripts/d3.v3.min.js”></script>
The script to be added should be kept at location:
C:\Jaspersoft\jasperreports-server-5.5\apache-tomcat\webapps\jasperserver-pro\scripts
In this blog we will be discussing two d3 charts I developed in jaspersoft.
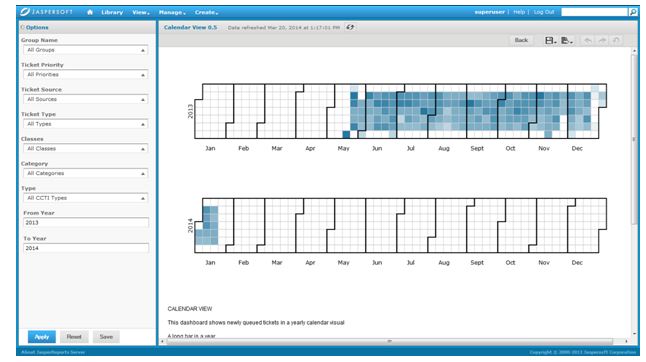
Calendar View:
Calendar view is basically used to show the action or value of a parameter across an entire year. There are 12 blocks which shows all the months, then every month is having subsequent sub-blocks which stands for dates in that month. Color gradient is also present for different dates (which is also configurable), thus depicting the intensity of the parameter across the entire year.
Calendar View graph in D3 present information using two sets of the SVG elements: (1) a set of dates and (2) Some value associated with each date. The color of each date element can be set according to the value on that particular date.
Integration with JasperServer:
The data which we use for developing the calendar view can be fetched from any database. The data fetched from database is stored in a variable and is then accessed in the html component using the same variable. Applying this of process makes the report dynamic instead of static. Few parameters can also be added in the report which can be used in query and/or html component.
Make data easy with Helical Insight.
Helical Insight is the world’s best open source business intelligence tool.
Generally for these type of charts we pass a variable which contains required data containing date and a value associated with it. The string is created according to JSON format, so that when accessed in script tag, can be easily converted to JSON object using eval function.
Any variable/parameter can be accessed as shown below:
“<script> var arr =”+$V{variable1}+” </script>”
Parameter in query:
Select * from table_name
where date between $P{parameter1} and $P{parameter2}
The sample code of static chart can be found at:
http://bl.ocks.org/mbostock/4063318
The steps on how to integrate it with jasperserver was discussed in my previous blog(D3 Integrating with Jasperserver).
http://helicaltech.com/d3-integration-jaspersoft-ireport-jasper-server/

Best Open Source Business Intelligence Software Helical Insight is Here