In this blog we will be discussing about D3 Bubble Chart Integration with Jaspersoft using HTML method of integration.
All the reports are develop using ireport 5.5 professional and jasper server 5.5
As html component of jasper server does not load any scripts in the html component, we loaded the script in one of the decorator page(jsp page). The page is located at the location:
C:\Jaspersoft\jasperreports-server-5.5\apache-tomcat\webapps\jasperserver-pro\WEB-INF\decorators\decorator.jsp
In the page we included the scripts which we want to load. We added the following code in the jsp page at line no 46:
<script type="text/javascript" language="JavaScript"

src="${pageContext.request.contextPath}/scripts/d3.v3.min.js"></script>
The script to be added should be kept at location:
C:\Jaspersoft\jasperreports-server-5.5\apache-tomcat\webapps\jasperserver-pro\scripts
Bubble Chart
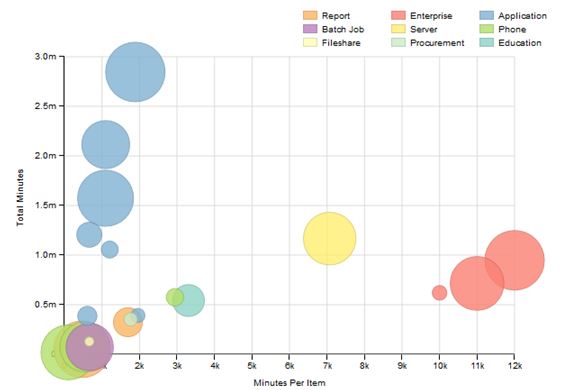
Bubble Charts Integration with Jaspersoft
- Bubble Chart:-
For this chart we need to include one more js script file in the decorator page as described in the start of the document.
The js file is sankey.js and can be downloaded from
http://dimplejs.org/dist/dimple.v1.1.5.min.js
Sample Code is shown below:
var svg = dimple.newSvg(“#chartContainer”, 1090, 500);
var data = [
{
“Date”:”1/1/2011″,
“Analyst”:”Cidalina Rivera”,
“Category”:”Application”,
“Total Minutes”:2114200,
“Minutes Per Item”:1100,
“% SLA”:80
},
{
“Date”:”1/1/2011″,
“Analyst”:”Kiran Parvathala”,
“Category”:”Application”,
“Total Minutes”:391800,
“Minutes Per Item”:1959,
“% SLA”:21
},
{
“Date”:”1/1/2011″,
“Analyst”:”KrishnaReddy Mavuru”,
“Category”:”Application”,
“Total Minutes”:1056125,
“Minutes Per Item”:1207,
“% SLA”:26
},
{
“Date”:”1/1/2011″,
“Analyst”:”Narasimha Dara”,
“Category”:”Application”,
“Total Minutes”:386740,
“Minutes Per Item”:610,
“% SLA”:30
},
{
“Date”:”1/1/2011″,
“Analyst”:”AslamJavid Shaik”,
“Category”:”Application”,
“Total Minutes”:1573856,
“Minutes Per Item”:1096,
“% SLA”:94
},
{
“Date”:”1/1/2011″,
“Analyst”:”Harini Vemulapalli”,
“Category”:”Application”,
“Total Minutes”:2846340,
“Minutes Per Item”:1890,
“% SLA”:100
},
{
“Date”:”1/1/2011″,
“Analyst”:”William Nelson”,
“Category”:”Application”,
“Total Minutes”:1205502,
“Minutes Per Item”:662,
“% SLA”:40
},
{
“Date”:”1/1/2011″,
“Analyst”:”Janaki Govindarajan”,
“Category”:”Batch Job”,
“Total Minutes”:72684,
“Minutes Per Item”:673,
“% SLA”:79
},
{
“Date”:”1/1/2011″,
“Analyst”:”Chiranjeevi Krishna Karne”,
“Category”:”Education”,
“Total Minutes”:542348,
“Minutes Per Item”:3307,
“% SLA”:52
},
{
“Date”:”1/1/2011″,
“Analyst”:”Masaru Hirata”,
“Category”:”Fileshare”,
“Total Minutes”:129090,
“Minutes Per Item”:662,
“% SLA”:12
},
{
“Date”:”1/1/2011″,
“Analyst”:”Naveen Kodali”,
“Category”:”Phone”,
“Total Minutes”:75076,
“Minutes Per Item”:548,
“% SLA”:84
},
{
“Date”:”1/1/2011″,
“Analyst”:”JoshyPeter Joseph”,
“Category”:”Phone”,
“Total Minutes”:574860,
“Minutes Per Item”:2948,
“% SLA”:27
},
{
“Date”:”1/1/2011″,
“Analyst”:”Maheshwar Malkapuram”,
“Category”:”Phone”,
“Total Minutes”:19845,
“Minutes Per Item”:105,
“% SLA”:92
},
{
“Date”:”1/1/2011″,
“Analyst”:”Sunil Bhalerao”,
“Category”:”Procurement”,
“Total Minutes”:353000,
“Minutes Per Item”:1765,
“% SLA”:20
},
{
“Date”:”1/1/2011″,
“Analyst”:”Tina Chan-Browne”,
“Category”:”Report”,
“Total Minutes”:51121,
“Minutes Per Item”:469,
“% SLA”:95
},
{
“Date”:”1/1/2011″,
“Analyst”:”Sirajuddin Mohammad”,
“Category”:”Report”,
“Total Minutes”:323363,
“Minutes Per Item”:1693,
“% SLA”:47
},
{
“Date”:”1/1/2011″,
“Analyst”:”Nishanth Nadam”,
“Category”:”Enterprise”,
“Total Minutes”:620000,
“Minutes Per Item”:10000,
“% SLA”:22
},
{
“Date”:”1/1/2011″,
“Analyst”:”Santoshkumar Shinde”,
“Category”:”Enterprise”,
“Total Minutes”:715000,
“Minutes Per Item”:11000,
“% SLA”:90
},
{
“Date”:”1/1/2011″,
“Analyst”:”Keith Moller”,
“Category”:”Enterprise”,
“Total Minutes”:948000,
“Minutes Per Item”:12000,
“% SLA”:100
},
{
“Date”:”1/1/2011″,
“Analyst”:”AshokKumar Sangeetham”,
“Category”:”Server”,
“Total Minutes”:1166550,
“Minutes Per Item”:7070,
“% SLA”:88
}
];
data = dimple.filterData(data, “Date”, “1/1/2011”);
var myChart = new dimple.chart(svg, data);
myChart.setBounds(400, 60, 500, 330);
myChart.addMeasureAxis(“x”, “Minutes Per Item”);
myChart.addMeasureAxis(“y”, “Total Minutes”);
myChart.addMeasureAxis(“z”, “% SLA”);
myChart.addSeries([“Analyst”,”Category”], dimple.plot.bubble);
myChart.addLegend(600, 10, 360, 30, “right”);
myChart.draw();
- Integration with JasperServer:
The data which we use for developing the calendar view can be fetched from any database. The data fetched from database is stored in a variable and is then accessed in the html component using the same variable. Applying this of process makes the report dynamic instead of static. Few parameters can also be added in the report which can be used in query and/or html component.
Generally for these type of charts we pass a variable which contains required data containing date, hour and a value associated with that particular date and hour. The string is created according to JSON format, so that when accessed in script tag, can be easily converted to JSON object using eval function.
Any variable/parameter can be accessed as shown below:
” var arr =”+$V{variable1}+” ”
Parameter in query:
Select * from table_name
where date between $P{parameter1} and $P{parameter2}
The steps on how to integrate it with jasperserver was discussed in my previous blog(D3 Integrating with Jasperserver).

Best Open Source Business Intelligence Software Helical Insight is Here
“This is a heading var svg = dimple.newSvg(“#chartContainer”, 1090, 500);var data = [{“Date”:”1-1-2014″,”Analyst”:”Cidalina Rivera”,”Category”:”Application”,”Total Minutes”:2114200,”Minutes Per Item”:1100,”% SLA”:80},{“Date”:”1/1/2011″,”Analyst”:”Kiran Parvathala”,”Category”:”Application”,”Total Minutes”:391800,”Minutes Per Item”:1959,”% SLA”:21}]; ”
I use this code but it is show is error:–
unexpected char: ‘#’ @ line 290, column 156. 1 error
Plz help me