Creating a Simple BIRT Report
This is a small tutorial to help you get started with BIRT report development. We will setup the BIRT report designer and create a simple tabular BIRT report accessing data from a MySQL database.
Make data easy with Helical Insight.
Helical Insight is the world’s best open source business intelligence tool.
Below are the steps –
Getting the BIRT report designer
You can download the BIRT report designer at http://download.eclipse.org/birt/downloads/ .
It provides various download options. I went with the “All-in-One” download package which included eclipse with all the necessary BIRT plugins preinstalled. You just need to unzip the archive file and then start the eclipse application.
Adding required drivers for DB connection
If you want to add any drivers for your database connections to be used in the designer, copy the driver jars to the below folder in your eclipse installation before you start eclipse –
<eclipse home>\plugins\org.eclipse.birt.report.data.oda.jdbc_X.X.X.vxxxxxxxxxxxx\drivers
In this case, I added the mysql driver jar file.
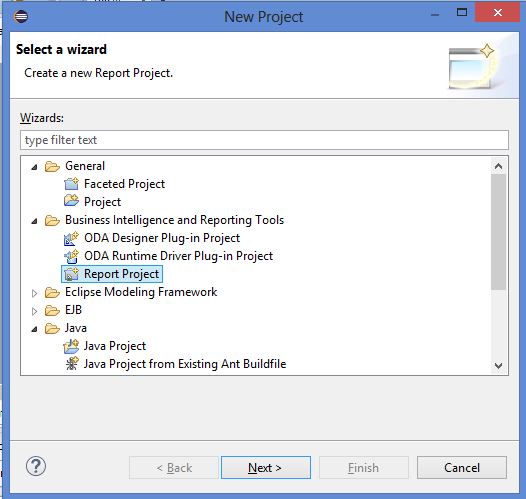
Creating a project
Once you have the report designer all set up, create a new project in eclipse with the “new project wizard”. You can see a new Projects Category appearing in the wizard selection list – “Business Intelligence and reporting tools”, select “Report Project” option under it.
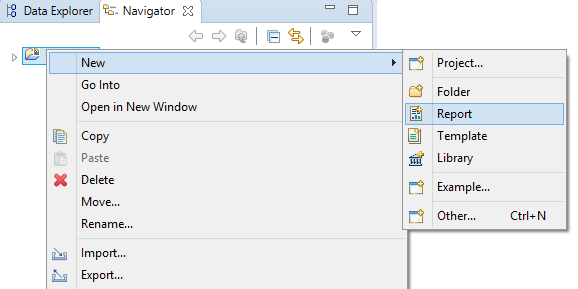
Adding BIRT report to the project
Now add a new report file (rptdesign) to the project. Right click on the project in the navigator window and click new à report, give an appropriate name to the file which will contain the report definition of the BIRT report. It’s a XML based report design – a single “.rptdesign” file which contains everything that is required for the report to execute.
Designing the report
When the “rptdesign” file is open, in the main window, it shows 4 tabs. It shows a canvas in the first tab, the visual layout view of the report – where you can drag and drop various items from the palette to design the report. The other tabs are the master page, scripts tab for you to add any custom scripts, the XML source tab to view the source of the design file as it gets generated.
In the “Outline” window, you can see the entire list of things that will define your report. We will now use this window to start adding components to our report.
Make data easy with Helical Insight.
Helical Insight is the world’s best open source business intelligence tool.
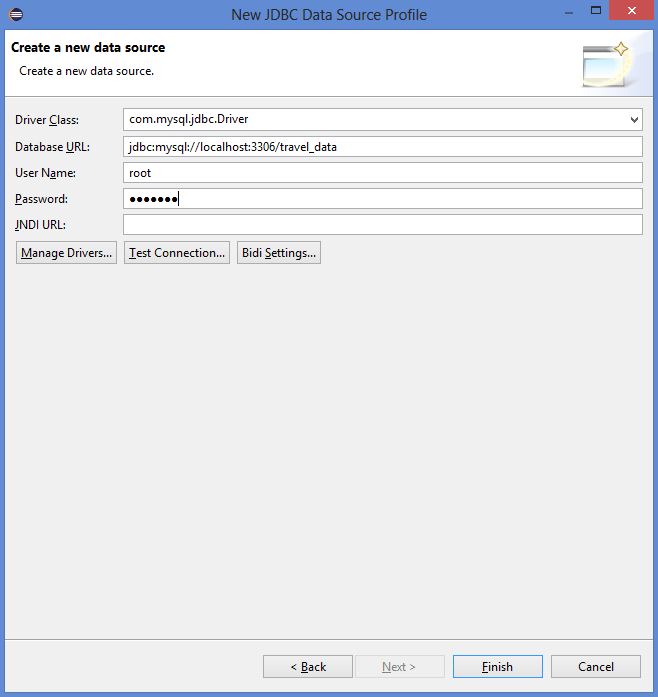
1. Creating a data source
Right click on the “Data Sources” in the Outline window and select “new Data Source” to open the wizard. It lists all the different types of data sources that can be created. For this tutorial, we select JDBC Data source and then fill in the required connection details to create the data source –
2. Creating a Data Set
A dataset is basically the query that would fetch the data to be displayed in your report. You can associate a dataset with your tables, charts and any other report elements.
Right Click on the “Data Sets” in the outline, to define your dataset. The wizard allows you to first select one of the datasets and then select the “Data Set Type” which in our case would be a SQL query. Write your SQL query text, which in our case is a simple select statement –
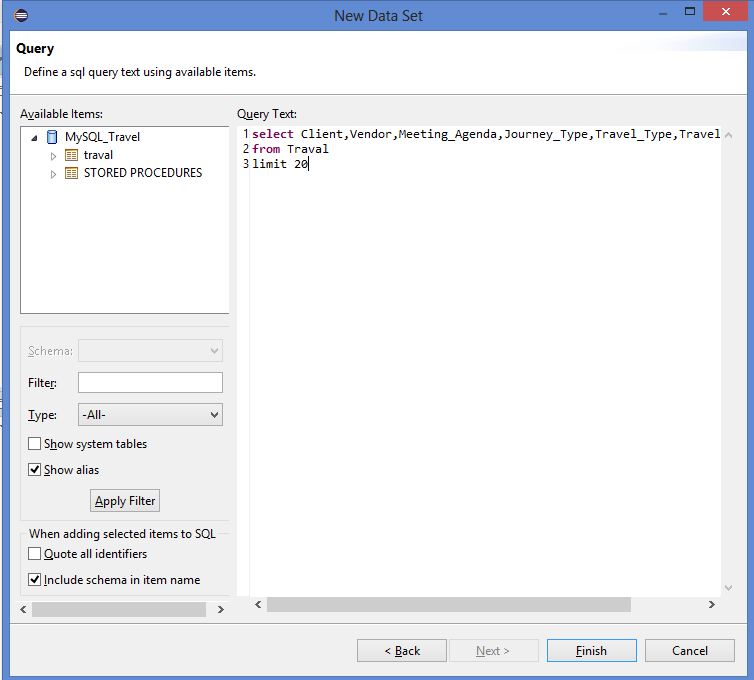
Once finished, all the fields start showing up under the dataset in the outline
3. Adding a table to the report
Now drag a “table” component from the palette and drop it on the canvas. When you do, it asks for a dataset to associate with the table. Select the one we created in the step above. It will display all the fields from the dataset from which you select the ones to be displayed in the table. When you click finish, you see a table on the canvas, with 3 sections – Header, Detail and Footer.
The detail section columns will be automatically bound with the various fields we selected and header labels will also be set.

You may use the “properties window” to format the table look and feel. I have added some borders and changed the font etc.

We are more or less done with a basic report. I also have changed the page heading for the report, by navigating to the “Master Page” tab and changing the same there.
Make data easy with Helical Insight.
Helical Insight is the world’s best open source business intelligence tool.

Previewing the report
There are various types of preview available –

When you preview in web viewer, the BIRT report viewer is used to render the report.

With this, our simple BIRT report is done!! More posts on BIRT reporting to follow, stay tuned !
Shraddha Tambe | Helical IT Solutions
You may also like to read –
Introduction to BIRT (Business Intelligence and Reporting Tools)