This blog will teach reader about Working with Crosstab Component In Pentaho Report Designer
Crosstab is an experimental feature in Pentaho Report Designer . By default we can’t see crosstab component in PRD.
Make data easy with Helical Insight.
Helical Insight is the world’s best open source business intelligence tool.
To enable this feature we need to do some modifications in Edit – > Preferences

In this Panel , go to “Other Settings” Tab and check the 2nd Option i.e, “Enable (unsupported) experimental features”.
Then Crosstab component will be automatically visible in PRD.
Data Source : JDBC : Sample Data Memory
Query :

If we will preview this query then we will get the data like below :
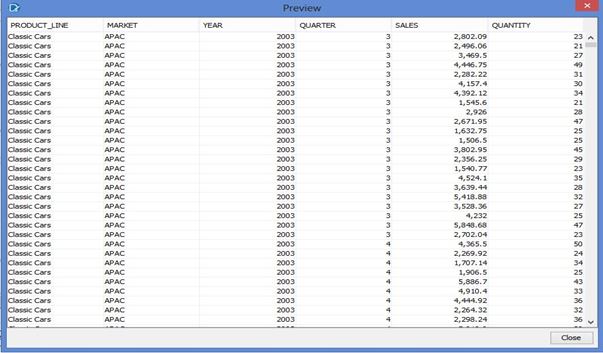
But In the above resultset it is very difficult to analyze the data .
So , its better visualization , I decided to create report with crosstab on this query .
Make data easy with Helical Insight.
Helical Insight is the world’s best open source business intelligence tool.
Steps :
- Go to Master Report in Structure Tab
- On the right click of Master Report click on Add Crosstab Group

- Then you will find the below window

- Here you need to decide which field you want to see in row and which in column , accordingly set the fields you will get the output .
EXAMPLE :

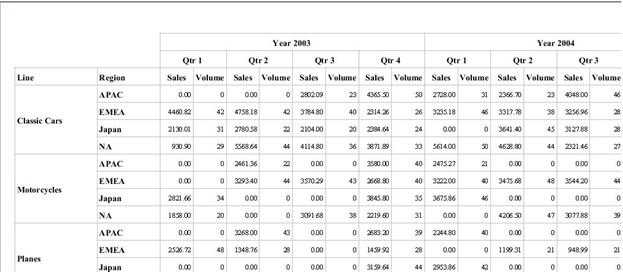
Now Preview the report you will find something like below :
Rupam Bhardwaj

Best Open Source Business Intelligence Software Helical Insight is Here
Hi Rupam
I am Alvaro from Peru, in Southamerica.
I am a newbie in Pentaho and I’m practicing report designer for Pentaho, your example is awesome and it helps me a lot driving crosstab in PRD but, please, may you explain, how to edit a crosstab? and how to apply format to crosstab?… thank you very much.
how you got grids in cross tab output?
can you please brief about it.
Hello Rupam,
Very nice blog. Could you please give us the steps to get the grid layout, that you showed in this blog? I am working on report that looks similar to your’s but having hard time to get the grid layout.
Appreciate your inputs.
Thanks.