Prerequisites: Jasper Studio 7.1 Enterprise version
Database: Foodmart
In this blog, we will discuss how to Change tick Interval on the Y-axis for Stacked bar graph on Jasper Server.
Make data easy with Helical Insight.
Helical Insight is the world’s best open source business intelligence tool.
Step1: Create a new Jasper report with Stores and Sales
Step2: From the Palette tab drag and drop High Charts.
Step3: Select appropriate stacked bar chart graph.
Step4: Deploy the report on the server and run the report
Step5: By default, it will take some intervals as shown in below stacked bar graph.
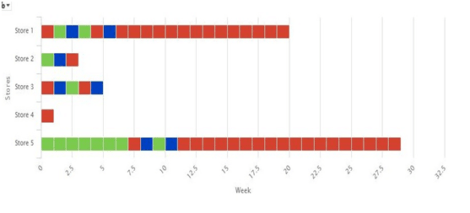
Now we can manipulate those intervals as per requirements.
Step6: Double click on the stacked Bar graph in the studio.
Step7: Select Chat Formatting –> Click on Show Advanced Properties.
Step8: In this we have Y-axis. Click on that and select “tickInterval”.
Step9: Edit property window will be open in that select “Use Expression”.
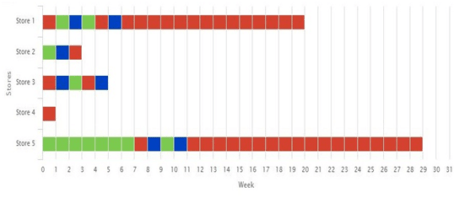
Step10: Now you will give expression as “new Integer(1)”.
Now Deploy the report on the server and run it. The output will be as shown in below stack bar chart.
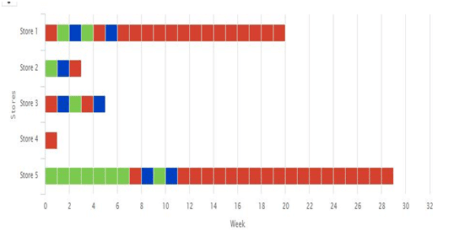
I will take one more example like I want Interval of 2. So I will give expression as “new Integer(2)” and run it on the server. The output will be shown in below chart.
Make data easy with Helical Insight.
Helical Insight is the world’s best open source business intelligence tool.

Best Open Source Business Intelligence Software Helical Insight is Here
A Business Intelligence Framework
In Case, if you have any queries please get us at support@helicaltech.com
Thank You
Eswar
Helical IT Solutions Pvt Ltd