A statistical time series model called Seasonal Autoregressive Integrated Moving Average (SARIMA) is used to predict future values of a time series based on historical observations. It is a special kind of ARIMA (Autoregressive Integrated Moving Average) model created to take seasonality in time series data into account.
According to the example given below, seasonality is the recurring pattern in a time series of data that happens at regular intervals, such as weekly, monthly, or annually. It is vital to include this data in the statistical model in order to successfully anticipate seasonality in time series data. SARIMA does this by fusing the ideas of moving averages and autoregression with seasonal considerations.
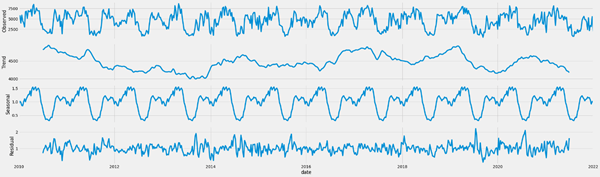
The moving average (MA), the difference component (I), and the autoregression (AR) component make up the fundamental three parts of a SARIMA model. The I component reflects the discrepancy between the observed and predicted values of the time series, whereas the AR component models the connection between past and future values of the time series. The random error or noise in the time series is modelled by the MA component. To explain the recurring patterns in the time series data, SARIMA combines these elements with seasonal influences.
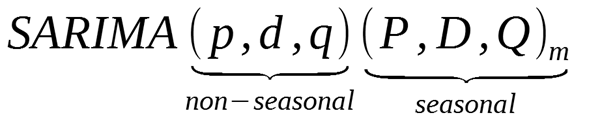
Three hyperparameters, denoted by p, d, and q, are used to specify SARIMA models. The parameters p, d, and q specify the order of the moving average component, differencing, and autoregression components, respectively. Moreover, P and Q are the two seasonal hyperparameters included in SARIMA models. These hyperparameters, which stand for the moving average component and seasonal autoregression order, respectively.
The hyperparameters p, d, q, P, and Q must be set to their ideal values in order to fit a SARIMA model. Combining trial-and-error with statistical methods like maximum likelihood estimate or AIC can be used to accomplish this (Akaike Information Criterion). The SARIMA model may be fitted to the time series data and used for forecasting when the hyperparameters have been chosen.
The ability of SARIMA models to detect seasonality in time series data is one of its key features. For predicting future values of time series data with repeated patterns, such as sales data or weather data, this is especially helpful. SARIMA models are accessible to a broad spectrum of users due to their ease of implementation and interpretation. It modifies the seasonality which is employed in terms of predicting for the following several years.
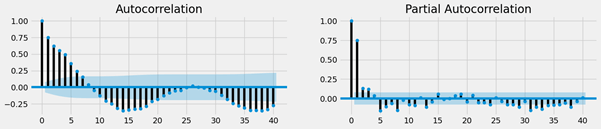
Role Of Partial Autocorrelation Function
A SARIMA (Seasonal Autoregressive Integrated Moving Average) model’s autoregressive (AR) component is sorted according to its order using a statistical technique known as partial autocorrelation function (PAF).
In a SARIMA model, the seasonal component reflects the effect of seasonality on the current value, while the moving average component (MA) and autoregressive component (AR) record the impact of previous forecasting mistakes on the current value.
The partial autocorrelation function (PAF), which accounts for the effects of all shorter lags, assesses the correlation between a time series and its own lagged values. In other words, after accounting for the effects of all shorter lags, the PAF at lag k measures the correlation between the time series and its own values lagged by k time units.
Because it helps to assess how many lagged values of the time series are meaningful in predicting the present value, the PAF is helpful in determining the order of the AR component of a SARIMA model. The number of significant lags in the PAF plot determines the order of the AR component.
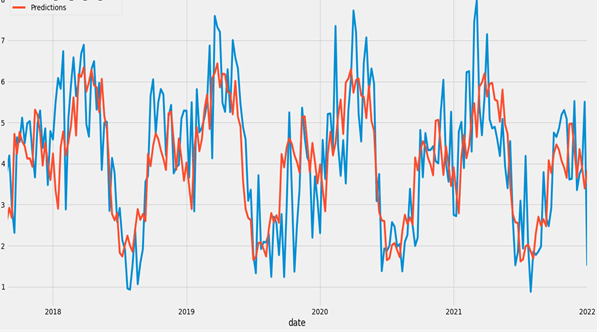
In order to increase the accuracy of the time series forecast, we can establish the proper order of the AR component in a SARIMA model by examining the PAF plot.
The SARIMA models do have certain drawbacks, though. The fact that they might not be ideal for time series data with complicated patterns, such as non-linear patterns or several seasonal cycles, is one of their main drawbacks. These circumstances may call for more sophisticated time series models, including state space models or neural networks. SARIMA models may also be sensitive to the selection of hyperparameters, which could result in varying outcomes for various iterations of the algorithm.
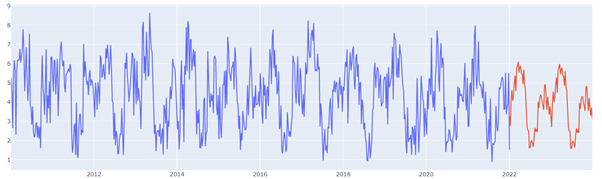
To sum up, SARIMA is an effective and popular time series model for predicting future values of time series data. It is a useful tool for predicting recurring trends in time series data since it is specifically developed to capture seasonality in time series data. SARIMA models have significant drawbacks, but they are generally easy to use and comprehend, making them available to a wide range of users. SARIMA is a useful technique to have in your toolkit for projecting future values of time series data, regardless of your level of data analysis experience.
Thank You
Utkarsh Soni
Helical IT Solutions

Best Open Source Business Intelligence Software Helical Insight is Here