Custom visuals are packages that include code for rendering the data served to them. Power BI is full of amazing pre-built visualizations, but your business is unique, and so are your data needs. Custom visuals can be used by anyone with the Power BI platform who needs better filtering options, detailed charts, interactive drill-down capabilities, or even industry-specific visuals to improve their dashboards and reports.
This blog explains the process of importing custom visualizations in Power BI Desktop.
Prerequisites: Power BI Desktop
Below are the steps to be followed to import custom visualization
- Open Power BI Desktop in your system
- From the Visualizations pane, click on the ellipses(…) icon.
- Then, Select ’Import from AppSource’ option from the dropdown.
- It gives a list of charts available in Marketplace. Choose required chart and click on Add.
- A pop up appears showing the status of the import. Click on OK if the import is successfull.
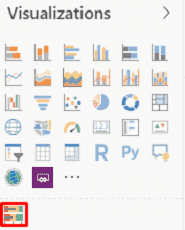
- Now, imported chart will be available in the Visualizations pane


In case if you have any queries please comment in the below comment section
Thank You
Mounika Pulimamidi
BI Developer
Helical IT Solutions Pvt Ltd

Best Open Source Business Intelligence Software Helical Insight Here
A Business Intelligence Framework
Best Open Source Business Intelligence Software Helical Insight is Here