Prerequisites:Jasper Server 7.1 community version,Jasper Studio 6.3
Database:Foodmart
Created a Sample Report which represents the Year wise sale bChart, the Line Chart ,but here we have came across one issue is not able to see the values on the data points
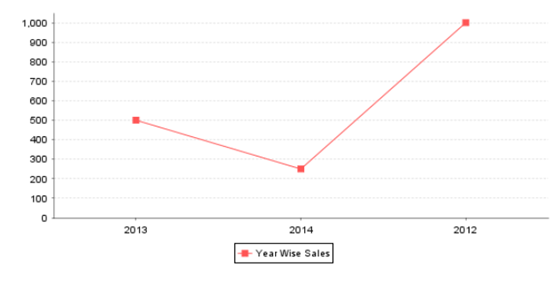
So to overcome the above issue we need to use chart customizer
Make data easy with Helical Insight.
Helical Insight is the world’s best open source business intelligence tool.
Use below JavaCode to display the Values on Data Points
public class LineChart implements JRChartCustomizer {
@Override
public void customize(JFreeChart chart, JRChart jasperChart)
{
CategoryPlot categoryPlot = (CategoryPlot)chart.getPlot();
NumberAxis rangeAxis = (NumberAxis) categoryPlot.getRangeAxis();
rangeAxis.setUpperMargin(0.25);
LineAndShapeRenderer lineAndShapeRenderer = (LineAndShapeRenderer)categoryPlot.getRenderer();
lineAndShapeRenderer.setBaseItemLabelsVisible(Boolean.TRUE);

lineAndShapeRenderer.setItemMargin(0.0D);
lineAndShapeRenderer.setBaseItemLabelFont(font3);
lineAndShapeRenderer.setBaseItemLabelGenerator(new StandardCategoryItemLabelGenerator());
}
}
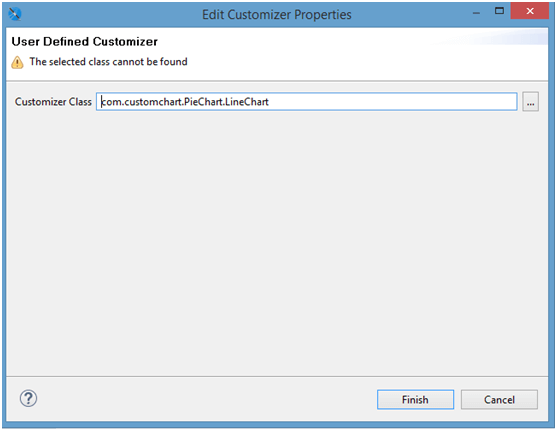
Create a Jar with above javacode and use the java class in chart customizer
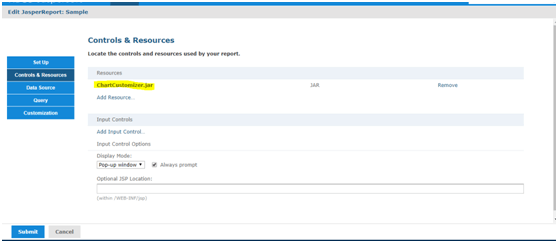
Add this JAR file to the Report
Check the Result by executing the Report in Jasper Server


Best Open Source Business Intelligence Software Helical Insight is Here
A Business Intelligence Framework
In case if you have any queries please get us at support@helicaltech.com
Thank You
Satya Gopi
Helical IT Solutions Pvt Ltd