D3 stands for Data-Driven Documents. D3.js is a JavaScript library for manipulating documents based on data. D3 helps you bring data to life using HTML, SVG and CSS. D3’s emphasis on web standards gives you the full capabilities of modern browsers. D3.js is written in JavaScript and uses a functional style which means you can reuse code and add specific functions.
Below is demo of how to create Bar chart in D3.
To set a D3 to your webpage you need only one file:
- D3 JavaScript file
You can choose solution to link to external services which host these file for you.
<!-- These belongs to the HTML file where you want D3 to work - put these lines into your <head> tag -->
<head>
<script type="text/javascript"src="//cdnjs.cloudflare.com/ajax/libs/d3/3.4.11/d3.v2.min.js"></script> </head>
We need to include style and javascript code inside HTML file itself.
<style>
body {
  font: 10px sans-serif;
}

.axis path,
.axis line {
  fill: none;
  stroke: #000;
  shape-rendering: crispEdges;
}

.bar {
  fill: orange;
}
.x.axis path {
  display: none;
}
</style>
We have to take data as input file in .json or .csv or .tsv format.
One of the key feature of D3 charts is SVG (Scalable Vector Graphics). Scalable Vector Graphics (SVG) is a family of specifications for creating two-dimensional vector graphics.
SVG comes with a basic set of shape elements:
- Rectangle
- Circle
- Ellipse
- Straight Line
- Polyline
- Polygon
<!---  Below is example of creating Rectangle in SVG -->
<svg width="50" height="50">
 <rect x="0" y="0" width="50" height="50" fill="green" />
</svg>
<!-- This is how we add SVG element -->
d3.select("body")
.append("svg")
.attr("width", 50)
.attr("height", 50)
.append("rectangle")
.attr("x", 0)
.attr("y", 0) .style("fill", "purple");
<!-- This is how we bound to DOM element -->
var theData = [ 1, 2, 3 ]
var p = d3.select("body").selectAll("p")
.data(theData)
.enter()
.append("p")
.text("hello ");
Inside script tag we will append SVG and javascript code.
<script>
var margin = {top: 40, right: 20, bottom: 30, left: 40},
width = 960 - margin.left - margin.right,
height = 500 - margin.top - margin.bottom;
var formatPercent = d3.format(".0%");
var x = d3.scale.ordinal()
.rangeRoundBands([0, width], .1);
var y = d3.scale.linear()
.range([height, 0]);
var xAxis = d3.svg.axis()
.scale(x)
.orient("bottom");
var yAxis = d3.svg.axis()
.scale(y)
.orient("left")
.tickFormat(formatPercent);
var svg = d3.select("body").append("svg")
.attr("width", width + margin.left + margin.right)
.attr("height", height + margin.top + margin.bottom)
.append("g")
.attr("transform", "translate(" + margin.left + "," + margin.top + ")");
d3.tsv("data.tsv", type, function(error, data) {
x.domain(data.map(function(d) { return d.letter; }));
y.domain([0, d3.max(data, function(d) { return d.frequency; })]);
svg.append("g")
.attr("class", "x axis")
.attr("transform", "translate(0," + height + ")")
.call(xAxis);
svg.append("g")
.attr("class", "y axis")
.call(yAxis)
.append("text")
.attr("transform", "rotate(-90)")
.attr("y", 6)
.attr("dy", ".71em")
.style("text-anchor", "end")
.text("Frequency");
svg.selectAll(".bar")
.data(data)
.enter().append("rect")
.attr("class", "bar")
.attr("x", function(d) { return x(d.letter); })
.attr("width", x.rangeBand())
.attr("y", function(d) { return y(d.frequency); })
.attr("height", function(d) { return height - y(d.frequency); })
});
function type(d) {
d.frequency = +d.frequency;
return d;
}
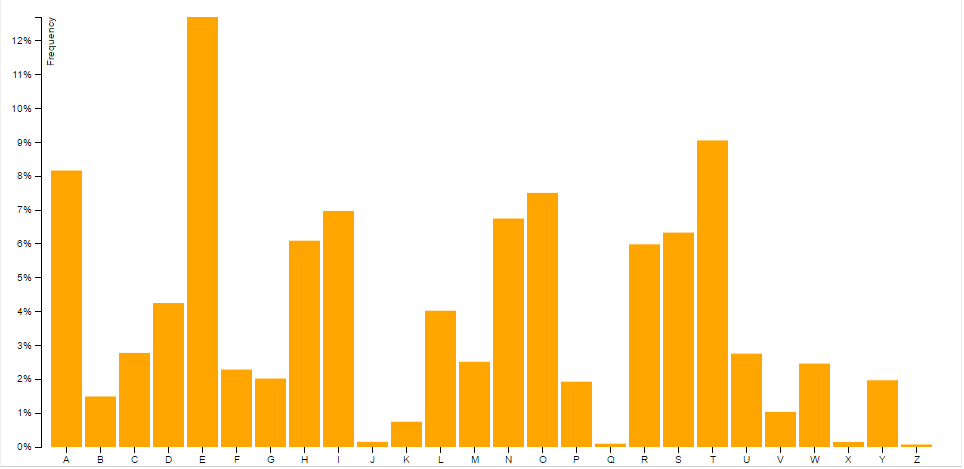
</script>At the end this is how Bar chart will look like.

Best Open Source Business Intelligence Software Helical Insight is Here
A Business Intelligence Framework
Thanks,
Krupal Barot
Charting data visualization JavaScript