Prerequisite: Jasper 6.3 studio
Database: Foodmart
In this blog we can see how we can use 2 datasets to plot an HTML5 Bar Chart, If we need to plot a chart by using 2 values from different queries then this is the way to achieve.
Make data easy with Helical Insight.
Helical Insight is the world’s best open source business intelligence tool.
I have created 2 simple queries, 1 for 2012 sales and the other for 2013 sales.
Select ‘2012’ as Year,round(sum(store_sales),2) from sales_fact_1997
Select ‘2013’ as Year,round(sum(store_sales),2) from sales_fact_1998
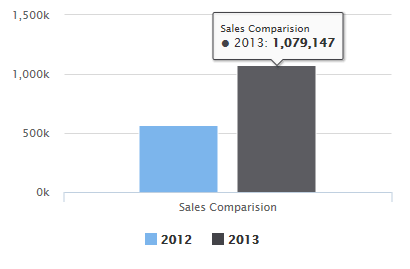
Expectation:
Step 1: Create a List Component for 2012 sales, and one variable within that dataset

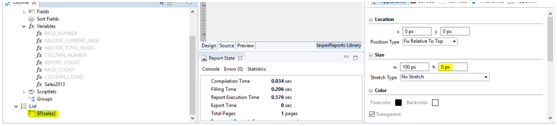
Step 2: Decrease the height of the Text field in that List to Zero, because we are not going to show this content on Report

Step 3: Create one more List for 2013 sales and one variable within that dataset
Step 4: Decrease the height of the Text field in that List to Zero, because we are not going to show this content on Report
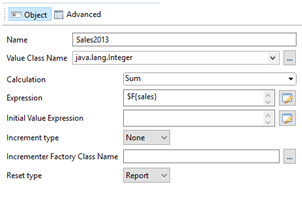
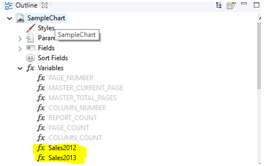
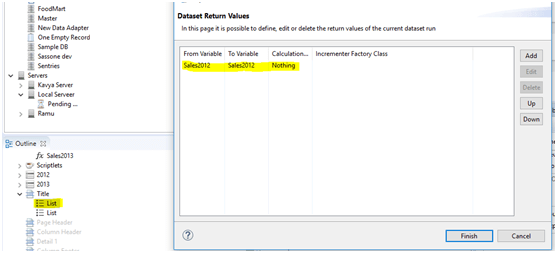
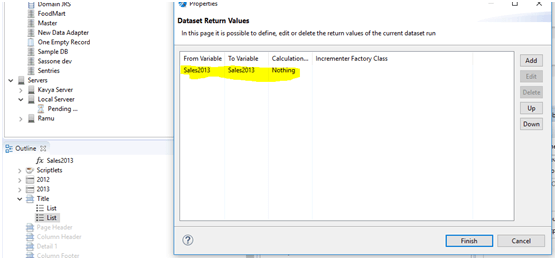
Step 5: Create 2 variables in Main Dataset and we will use these variables to return the values from List Components
Step 6: Return the Values from List Component as follows
Make data easy with Helical Insight.
Helical Insight is the world’s best open source business intelligence tool.
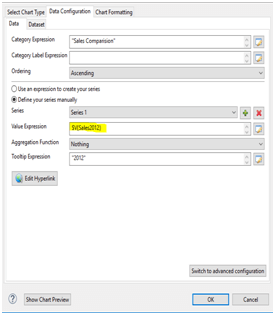
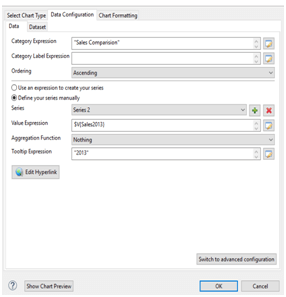
Step 7: Use these Variables in HTML5 Bar chart, by creating 2 series for 2 variables
Step 8: Run the Report and we will get the expected output
Thank You
Satya Gopi
Helical IT Solutions Pvt Ltd

Best Open Source Business Intelligence Software Helical Insight Here
A Business Intelligence Framework
Best Open Source Business Intelligence Software Helical Insight is Here