This blog will talk about how to create candlestick chart in Jaspersoft.
PREREQUISITE S/W:-
- Jaspersoft(any version)
- iReport tool(design)
- d/b softwares (eg.MySql)
- JAVA
- Eclipse(if require)
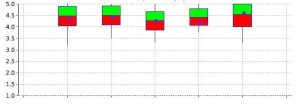
WHAT IS CANDLE STICK CHART?
The candlestick techniques we use today originated in the style of technical charting used by the Japanese for over 100 years before the West developed the bar and point-and-figure analysis systems. In the 1700s, a Japanese man named Homma, a trader in the futures market, discovered that, although there was a link between price and the supply and demand of rice, the markets were strongly influenced by the emotions of traders.
HOW TO READ CANDLESTICK CHART?
In order to create a candlestick chart, you must have a data set that contains open, high, low and close values for each time period you want to display. The hollow or filled portion of the candlestick is called “the body” (also referred to as “the real body”). The long thin lines above and below the body represent the high/low range and are called “shadows” (also referred to as “wicks” and “tails”). The high is marked by the top of the upper shadow and the low by the bottom of the lower shadow.

FORMATION:
STEPS:-
1. Create report in i-report designer, select Blank A4 size report from ireport designer.
Ex:
File > New > Blank A4
(here eg.DemoOfCandlestickchart->NEXT->FINISH)
2. Delete all band except summary band
3. Goto-> Palette window tool->Select chart->Select MultiAxis chart->Select TimeSeries chart->Ok
4. Right Click on Multiaxis chart->Select Add Exist Chart->Select Candlestick chart->Ok
(add two candlestick chart into multiaxis chart)
While writing query keep in mind following things:
• For input values to Candlestick chart we require 5 values for each chart
High value
Low value
Open value
Close value
Volume value
Example:-
select
avg(0) as avg,
MAX(0) as max,
MIN(0) as min,
STDDEV(0) as std_dev,
“dummy” as _lable,
1-1-1111 as _date,
as abc from dual
· Add new Dataset ->Write query->add it
· Goto -> Report Inspector->Summary band-> Select candlestick chart (first)
->Right click on it ->Select chart data->goto chart data
Note:- Generally creating single candlestick chart first candlestick High-close value are same and second chart Low-close value are same

5. Similarly as mentioned above instruction set data for another chart .
Eg:

Best Open Source Business Intelligence Software Helical Insight is Here