MARIMEKKO CHARTS
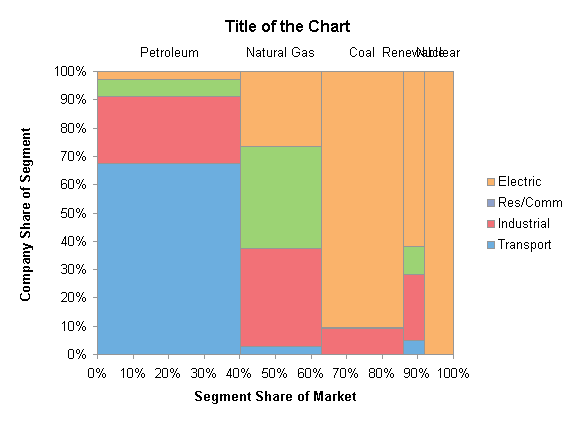
What is Marimekko Chart? A Marimekko chart is a two-dimensional 100% chart, in which the width of a column is proportional to the total of the column’s values. Data input is similar to a 100% chart, with data represented as either absolute values or percentages of a given total.
Marimekko charts are widely adopted in Marketing for example to analyze customer segmentation and market segmentation.
This graph encodes two quantitative variables: one using the height and one using the width of the bars. For example – By attending to the heights of each bar segment, we can see what percentage of each company’s total sales were handled by each of the three sales channels. By attending to the widths of the bars, we can see the relative magnitudes of each company’s total sales. Each company’s sales in each individual channel is encoded through the areas of the rectangles (that is, the individual bar segments).
For instance, comparisons between Reebok’s U.S. sales and Adidas’ International sales can be made by comparing the areas of the two rectangles that represent them.
Caution?
The following points need to be kept in mind while desiging Marimekko charts
– Bars should be of the same heights
– Values in the columns to be preset in the percentage format
Disadvantages of Marimekko Charts?
– Viewing graph as a whole is fine & reveals a lot of insights, but when we want to make comparisons between individual specific boxes, that is generally difficult.
– Marimekko graphs suffer from a problem that plagues any stacked bar graph: It is difficult to accurately make comparisons of the width or height of boxes that are not arranged next to one another along a common baseline.
Industry Specific Example?
– Generally used for marketing analysis all competitors in a particular market segment and individual share of competitors in each of the market segments. For ex – market share of three mobile handset makers (Nokia, Samsung, Motorola) in three segments (feature phone, smart phone, basic phone) and the share of each segment in the market itself using Marimekko charts

Best Open Source Business Intelligence Software Helical Insight is Here