CANDLESTICK CHARTS
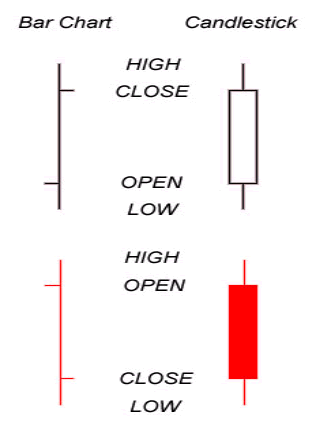
What is Candlestick Chart? A candlestick chart is a style of bar-chart used primarily to describe price movements of a security, derivative, or currency over time. It is a combination of a line-chart and a bar-chart, in that each bar represents the range of price movement over a given time interval. It is most often used in technical analysis of equity and currency price patterns. They appear superficially similar to box plots, but are unrelated.thought to have been developed in the 18th century by Munehisa Homma, Japanese rice trader of financial instruments
Best Practices while using Candlestick Chart:-
Below mentioned are some of the best practices which are often used while plotting Candlestick chart –
-
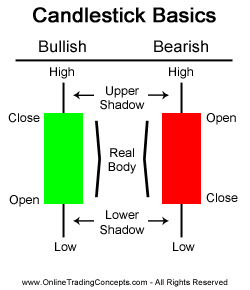
Blue (or green) candlestick if the close is higher than the open;
-
Red candlestick if the open is higher than the close (i.e. the candlestick is filled);
-
The same color as the previous day, if the open is equal to the close.
-
Long white real body visually displays the bulls are in charge
-
Long black real body signifies the bears are in control.
-
Small real body (white or black) indicates a period in which the bulls and bears are in a “tug of war” and warns the market’s trend may be losing momentum.
While the real body is often considered the most important segment of the candlestick, there is also substantial information from the length and position of the shadows. For instance, a tall upper shadow shows the market rejected higher prices while a long lower shadow typifies a market that has tested and rejected lower prices.
Advantages of Candlestick Chart :–
– Easy to understand the pattern & trend
– Provides historical analysis as well in a compact form
– Candlestick charts not only show the trend of the move, as does a bar chart, but, unlike bar charts, candlestick charts also show the force underpinning the move
Industry Usage :–
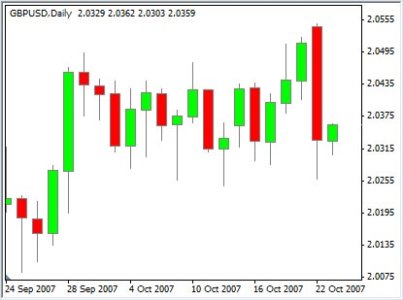
– Candlestick charts are a visual aid for decision making in stock, foreign exchange, commodity, and option trading.
– Analyze currency comparison (lets say Indian rs is higher or lower at the end of the day as compared to starting of the day) – correspondingly we can fill the box with some shade or color etc

Best Open Source Business Intelligence Software Helical Insight is Here
This is amazing! Keep up the good work!