Pentaho Community Dashboard Editor (CDE)
CTools Website – Community Tools
https://github.com/webdetails
What is CDE ?
* CDE is one of the plugins for Pentaho BI Server, contributed and maintained by Pentaho Partner webdetails.
* We create dashboards using this tool.
* Community Dashboard Editor (CDE) was born to simplify the creation, edition and rendering processes of the CTools Dashboards.
* CDE is a very powerful and complete tool, combining front end with data sources and custom components in a seamless way.
Where you can get the plug-in in Pentaho Community Server ?
How to download the plug-in & what are the dependencies?
You can find the symbol “Pentaho Market place” on the menu bar..
Click on it you can see the Pentaho Marketplace editor as shown in below figure.
Find Community Dashboard Editor and Click on install.
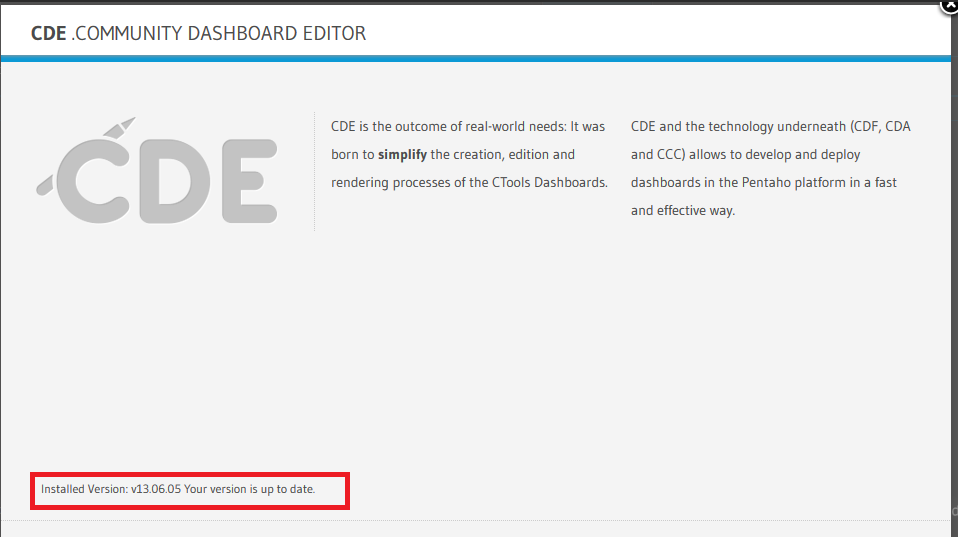
As I have already installed it is showing as Up to Date.
Its generally a good practice to keep on updating the plugins with the latest version available in the market.
NOTE:
You must install the dependent plug-ins before you start working with CDE.

CDF(Community Dashboard Framework)
CDA(Community Data Access)
You must restart your server to take the effect of installation.
Where you can find the sample examples after installing?
* In the left side panel you can find plugin-samples folder.
* Expand it and then click on CDE
* In the Files you can find sample example CDE Sample Dashboard.
* Right Click on CDE_Sample Dashboard àThen click on Edit.
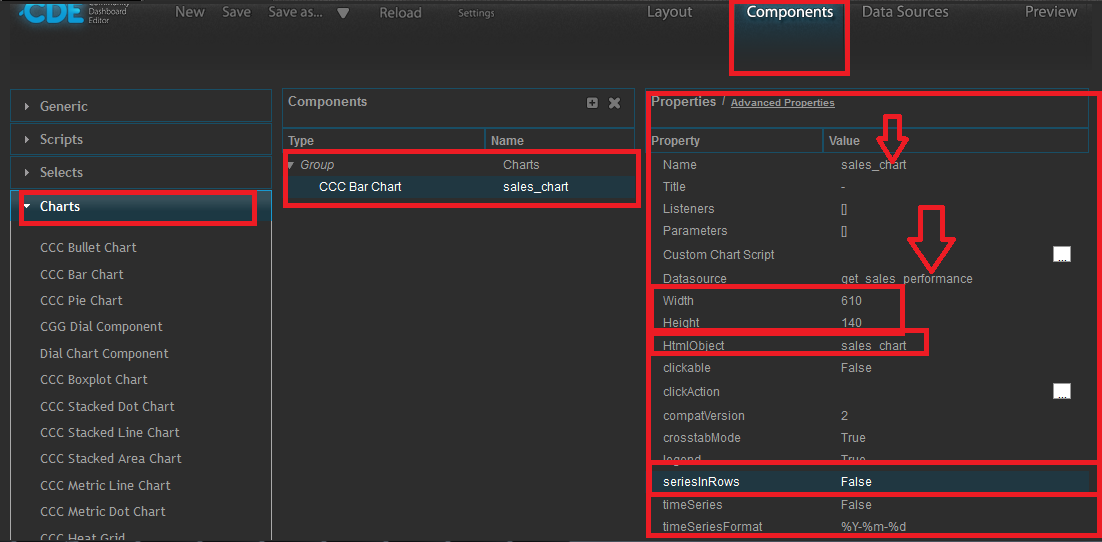
CDE has 3 major components
They are.
* Layout
* Componets
* Data Sources.CDE has developed based on MVC-2 architecture of Advanced Java Technologies.
* Layout – View
* Components – Controller
* Data sources – Model.
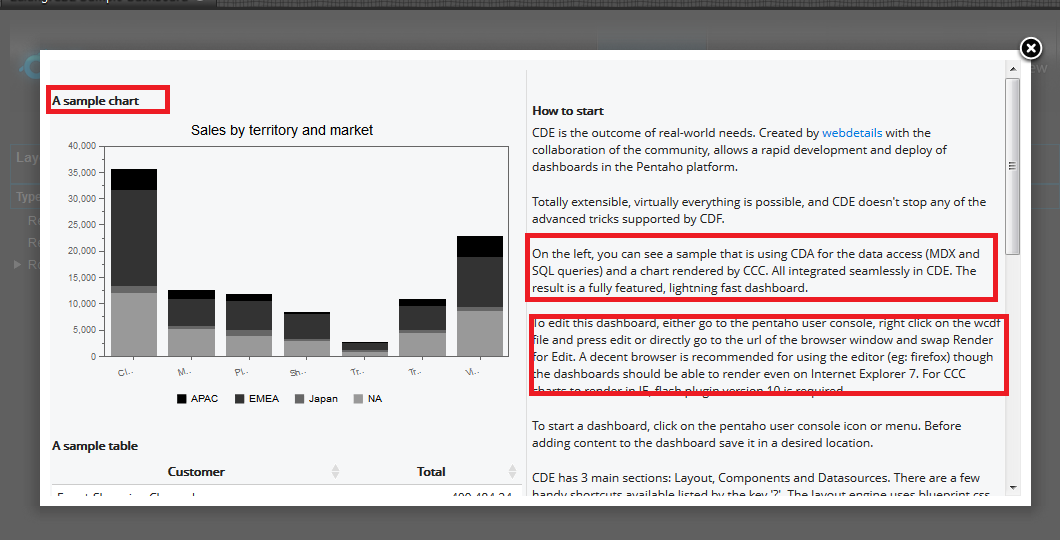
Find the images below to understanding the basic of CDE.

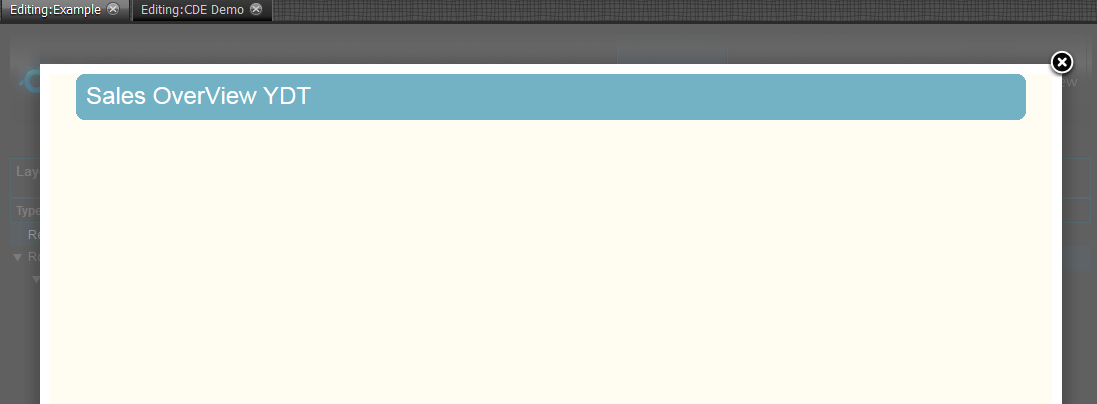
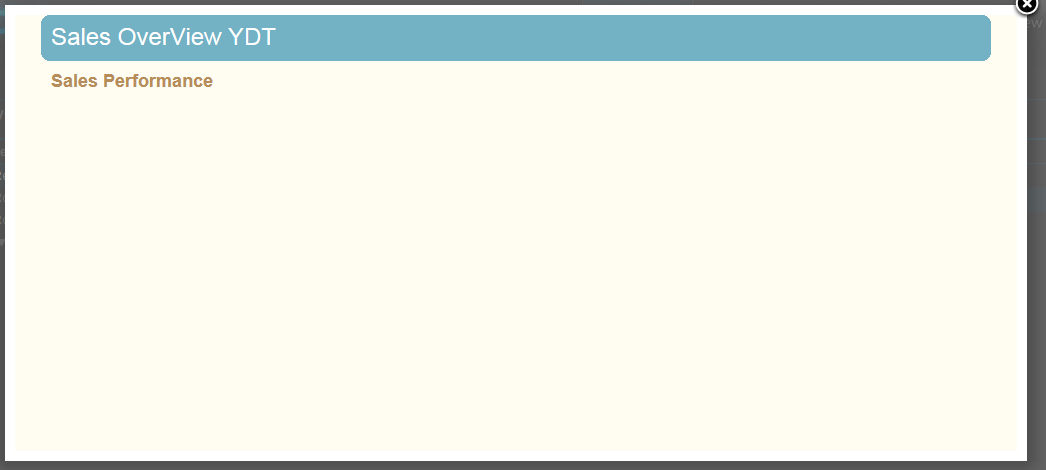
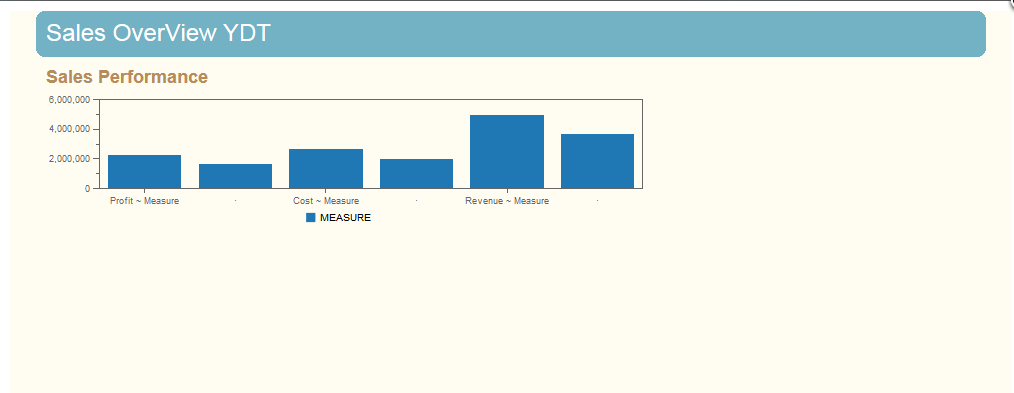
* Now, just click on Preview. You can find the output of the dashboard as shown in below figures.
 * Scroll down.
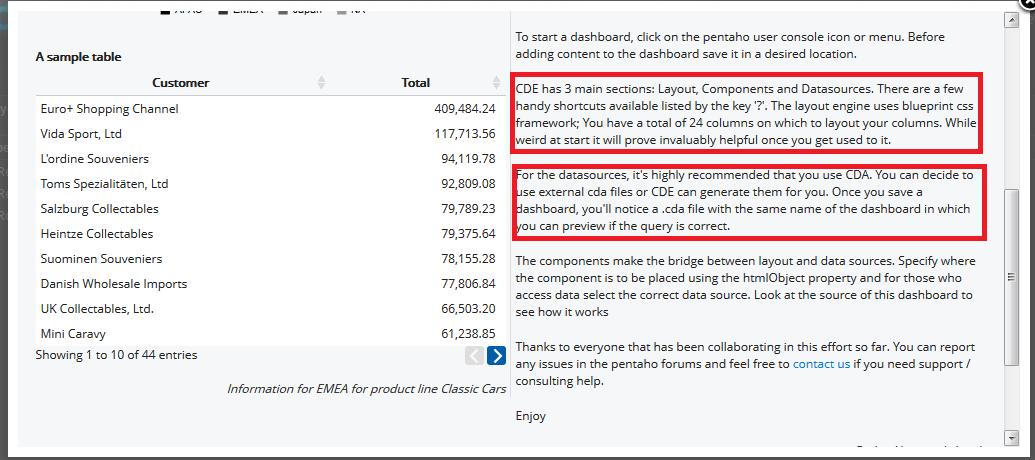
Aim : To design a simple chart(on dashboard)
Environment:
* Pentaho BI Server community 4.8 stable version.
* CDA,CDF & CDE installed in the server from Market place.
Database: SampleData (It comes along with pentaho installation.. for this artical I’m not connecting to any external database.)
http://type-exit.org/adventures-with-open-source-bi/2011/06/creating-dashboards-with-cde/comment-page-2/#comments
* There are a lot of changes made from CCC-V1 to CCC-V2.
* Make sure your environment of CDE supports CCC-V2 for the example.
There are two ways to create a new CDE dashboard.
i) From the menu bar
ii) By clicking CDE icon

After saving your dashboard “Refresh your Repository” and then you can find the file as shown below figure.


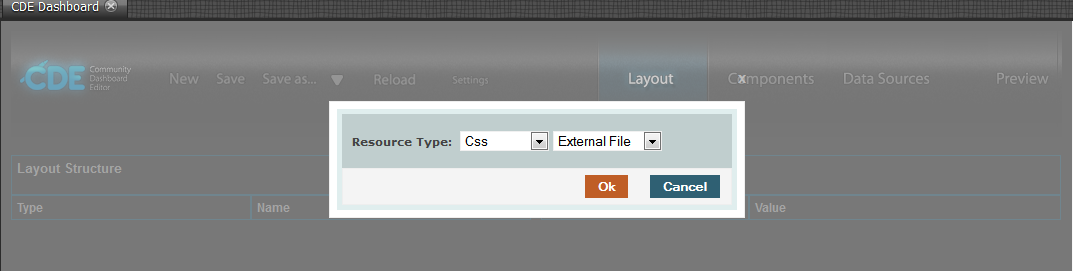
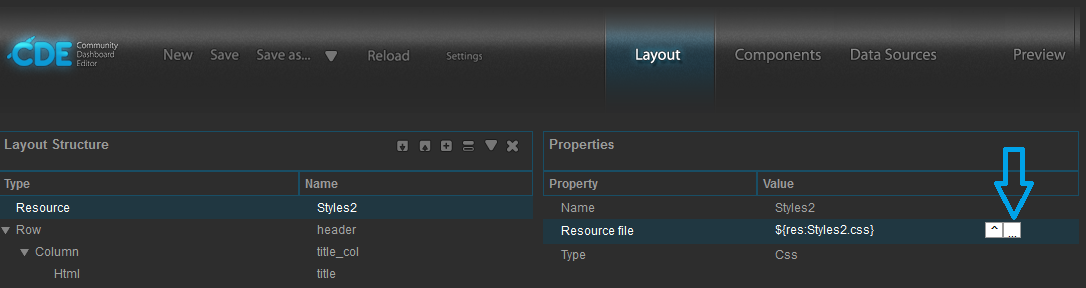
Resource file : click on ^ that is highlighted using arrow in the below image.


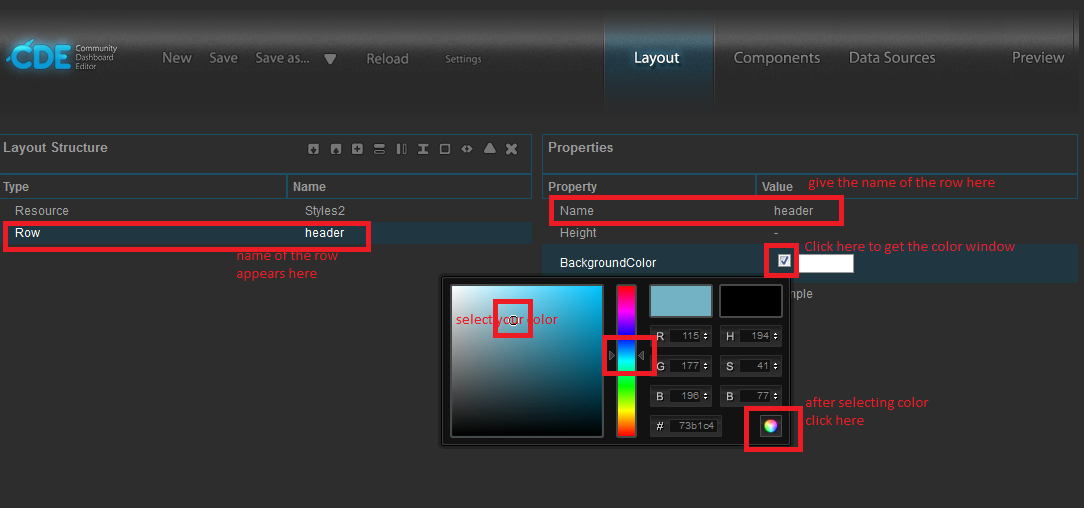
* Give name of the Row and give back ground colour as shown in below figure.
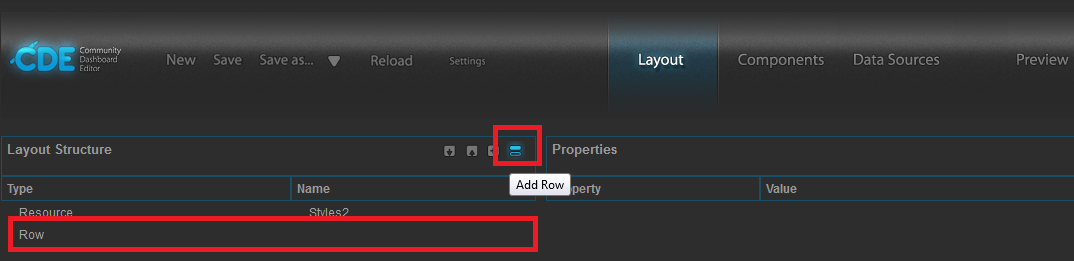
* Now add Column(find ||) symbol on Layout Structure and click on it.


|
Body{
background-color:#fffdf1;
}
h1{
font-size:24px;
color:#fff;
margin-left:10px;
margin-top:10px;
}
|
By the time you get some idea on it.
|
h3{
font-size:18px;
font-weight:bold;
color:#b68c58;
margin-left:10px;
margin-top:10px;
margin-bottom:8px;
}
.salesTitle{
color:#666;
height:2px;
margin-top:10px;
margin-left:10px;
margin-bottom:2px;
width:939px;
}
|
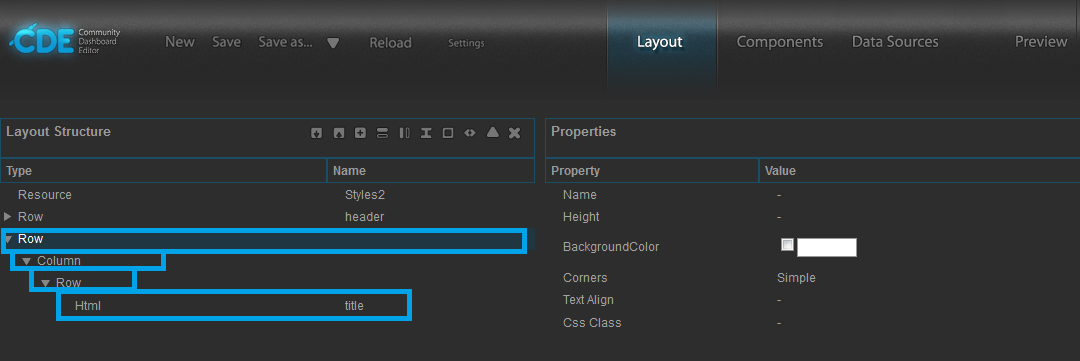
Add another column as shown in below figure
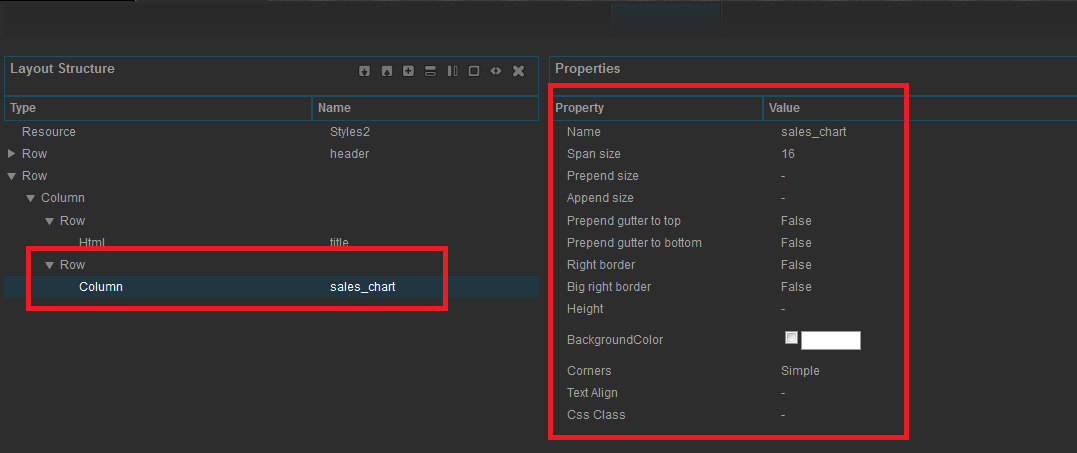
Give the following properties:
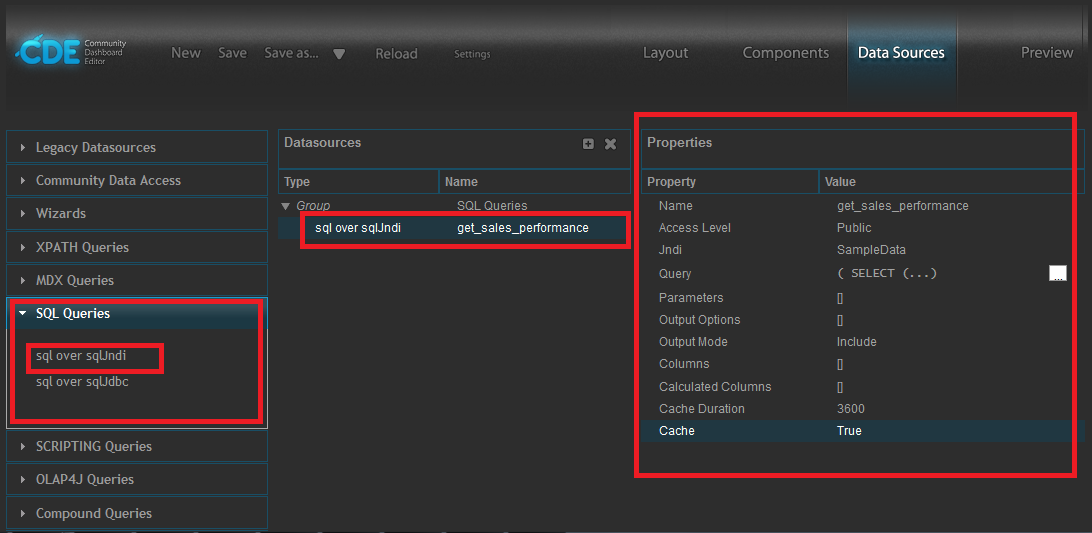
Click on Data Sources
|
(
SELECT
‘Profit’ as CATEGORY,
‘Measure’ as SERIES,
SUM(ORDERFACT.TOTALPRICE-ORDERFACT.QUANTITYORDERED*PRODUCTS.BUYPRICE) AS MEASURE
FROM
ORDERFACT
INNER JOIN PRODUCTS ON PRODUCTS.PRODUCTCODE = ORDERFACT.PRODUCTCODE
WHERE
YEAR_ID = 2004
)
UNION ALL
(
SELECT
‘Profit’ as CATEGORY,
‘Target’ as SERIES,
SUM(ORDERFACT.TOTALPRICE-ORDERFACT.QUANTITYORDERED*PRODUCTS.BUYPRICE) AS MEASURE
FROM
ORDERFACT
INNER JOIN PRODUCTS ON PRODUCTS.PRODUCTCODE = ORDERFACT.PRODUCTCODE
WHERE
YEAR_ID = 2003
)
UNION ALL
(
SELECT
‘Cost’ as CATEGORY,
‘Measure’ as SERIES,
SUM(ORDERFACT.QUANTITYORDERED*PRODUCTS.BUYPRICE) AS MEASURE
FROM
ORDERFACT
INNER JOIN PRODUCTS ON PRODUCTS.PRODUCTCODE = ORDERFACT.PRODUCTCODE
WHERE
YEAR_ID = 2004
)
UNION ALL
(
SELECT
‘Cost’ as CATEGORY,
‘Target’ as SERIES,
SUM(ORDERFACT.QUANTITYORDERED*PRODUCTS.BUYPRICE) AS MEASURE
FROM
ORDERFACT
INNER JOIN PRODUCTS ON PRODUCTS.PRODUCTCODE = ORDERFACT.PRODUCTCODE
WHERE
YEAR_ID = 2003
)
UNION ALL
(
SELECT
‘Revenue’ as CATEGORY,
‘Measure’ as SERIES,
SUM(ORDERFACT.TOTALPRICE) AS MEASURE
FROM
ORDERFACT
WHERE
YEAR_ID = 2004
)
UNION ALL
(
SELECT
‘Revenue’ as CATEGORY,
‘Target’ as SERIES,
SUM(ORDERFACT.TOTALPRICE) AS MEASURE
FROM
ORDERFACT
WHERE
YEAR_ID = 2003
)
|

Best Open Source Business Intelligence Software Helical Insight is Here
Agree with you – CDE is really powerful tool for dashboard creation. Personally I do not work with it but after your post all the details are settled down as they should be, all is so clearly written and explained. Looking forward to your new article. Thanks!
Yeah, I have a problem where the weahter actually stays in metric units after I have unchecked that option in the properties. Is it possible there is some interference with the http requests?