This blog will be talking about the different layers of Mondrian engine, its components, introduction to ROLAP etc.
Layers of a Mondrian system
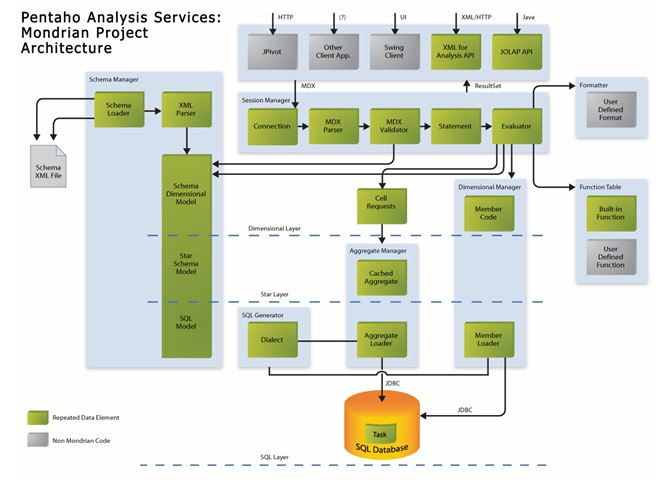
A Mondrian OLAP System consists of four layers; these are as follows:
- Presentation layer
The presentation layer determines what the end-user sees on his or her monitor, and how he or she can interact to ask new questions. There are many ways to present multidimensional datasets, including pivot tables, pie, line and bar charts, and advanced visualization tools such as clickable maps and dynamic graphics. These might be written in Swing or JSP, charts rendered in JPEG or GIF format, or transmitted to a remote application via XML. What all of these forms of presentation have in common is the multidimensional ‘grammar’ of dimensions, measures and cells in which the presentation layer asks the question is asked, and OLAP server returns the answer.
- Dimensional layer
The second layer is the dimensional layer. The dimensional layer parses, validates and executes MDX queries. A query is evaluated in multiple phases. The axes are computed first, then the values of the cells within the axes. For efficiency, the dimensional layer sends cell-requests to the aggregation layer in batches. A query transformer allows the application to manipulate existing queries, rather than building an MDX statement from scratch for each request. And metadata describes the dimensional model, and how it maps onto the relational model.
- Star layer
The third layer is the star layer, and is responsible for maintaining an aggregate cache. An aggregation is a set of measure values (‘cells’) in memory, qualified by a set of dimension column values. The dimensional layer sends requests for sets of cells. If the requested cells are not in the cache, or derivable by rolling up an aggregation in the cache, the aggregation manager sends a request to the storage layer.
- Storage layer.
The storage layer is an RDBMS. It is responsible for providing aggregated cell data, and members from dimension tables.
These components can all exist on the same machine, or can be distributed between machines. Layers 2 and 3, which comprise the Mondrian server, must be on the same machine. The storage layer could be on another machine, accessed via remote JDBC connection. In a multi-user system, the presentation layer would exist on each end-user’s machine (except in the case of JSP pages generated on the server).
ROLAP Defined
Pentaho Analysis is built on the Mondrian relational online analytical processing (ROLAP) engine. ROLAP relies on a multidimensional data model that, when queried, returns a dataset that resembles a grid. The rows and columns that describe and bring meaning to the data in that grid are dimensions, and the hard numerical values in each cell are the measures or facts. In Pentaho Analyzer, dimensions are shown in yellow and measures are in blue.
ROLAP requires a properly prepared data source in the form of a star or snowflake schema that defines a logical multidimensional database and maps it to a physical database model. Once you have your initial data structure in place, you must design a descriptive layer for it in the form of a Mondrian schema, which consists of one or more cubes, hierarchies, and members. Only when you have a tested and optimized Mondrian schema is your data prepared on a basic level for end-user tools like Pentaho Analyzer and JPivot.
Workflow Overview
To prepare data for use with the Pentaho Analysis (and Reporting, to a certain extent) client tools, you should follow this basic workflow:
Design a Star or Snowflake Schema
The entire process starts with a data warehouse.The end result should be data model in the star or snowflake schema pattern. You don’t have to worry too much about getting the model exactly right on your first try. Just cover all of your anticipated business needs; part of the process is coming back to the data warehouse design step and making changes to your initial data model after you’ve discovered what your operational needs are.
Populate the Star/Snowflake Schema
Once your data model is designed, the next step is to populate it with actual data, thereby creating your data warehouse. The best tool for this job is Pentaho Data Integration, an enterprise-grade extract, transform, and load (ETL) application.
Build a Mondrian Schema
Now that your initial data warehouse project is complete, you must build a Mondrian schema to organize and describe it in terms that Pentaho Analysis can understand. This is also accomplished through Pentaho Data Integration by using the Agile BI plugin. Just connect to your data warehouse and auto-populate your schema with the Modeler graphical interface. Alternatively, you can use Pentaho Schema Workbench to create an analysis schema through a manual process.
Initial Testing
At this point you should have a multi-dimensional data structure with an appropriate metadata layer. You can now start using Pentaho Analyzer and JPivot to drill down into your data and see if your first attempt at data modeling was successful. In all likelihood, it will need some adjustment, so take note of all of the schema limitations that you’re unhappy with during this initial testing phase.
Do not be concerned with performance issues at this time — just concentrate on the completeness and comprehensiveness of the data model.
Adjust and Repeat Until Satisfied
Use the notes you took during the testing phase to redesign your data warehouse and Mondrian schema appropriately. Adjust hierarchies and relational measure aggregation methods. Create virtual cubes for analyzing multiple fact tables by conforming dimensions. Re-test the new implementation and continue to refine the data model until it matches your business needs perfectly.
Test for Performance
Once you’re satisfied with the design and implementation of your data model, you should try to find performance problems and address them by tuning your data warehouse database, and by creating aggregation tables. The testing can only be reasonably done by hand, using Pentaho Analyzer and/or JPivot. Take note of all of the measures that take an unreasonably long time to calculate. Also, enable SQL logging and locate slow-performing queries, and build indexes for optimizing query performance.
Create Aggregation Tables
Using your notes as a guide, create aggregation tables in Pentaho Aggregation Designer to store frequently computed analysis views. Re-test and create new aggregation tables as necessary.
If you are working with a relatively small data warehouse or a limited number of dimensions, you may not have a real need for aggregation tables. However, be aware of the possibility that performance issues may come up in the future.
Check in with your users occasionally to see if they have any particular concerns about the speed of their BI content.
Deploy to Production
Your data warehouse and Mondrian schema have been created, tested, and refined. You’re now ready to put it all into production. You may need to personally train or purchase Pentaho training for anyone in your organization who needs to create traditional reports, dashboards, or Analyzer reports with Pentaho’s client tools.

Best Open Source Business Intelligence Software Helical Insight is Here