Tab Pane in Dashboard containing charts using C3 library.
In this blog I’ll discuss how we can create tab menu in the dashboards if one need html reports in the web pages. On click of these tab menus the report will change in the body section of the page.
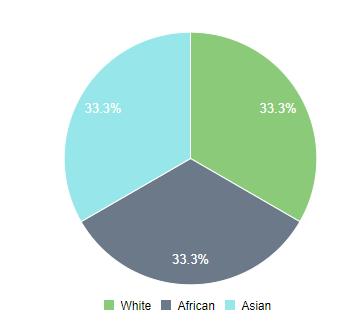
Overview : For creating different charts you can use http://c3js.org/ as its free and create any chart as per your requirement. Here in this example I have used Bar chart and pie chart in my dashboard. And the individual charts will load on click of the individual tab buttons.
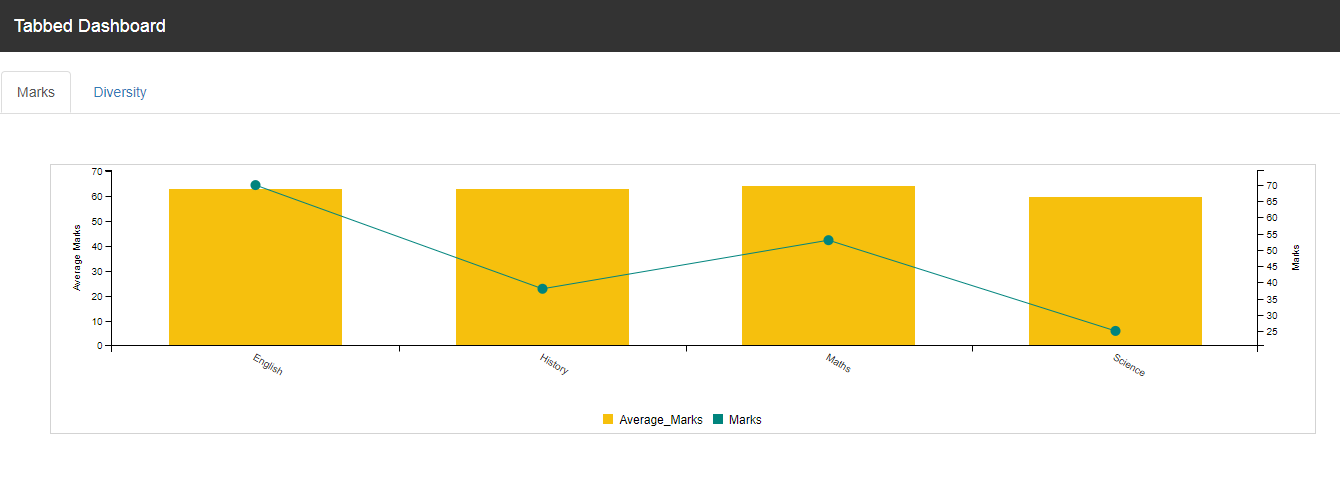 Fig 1.1
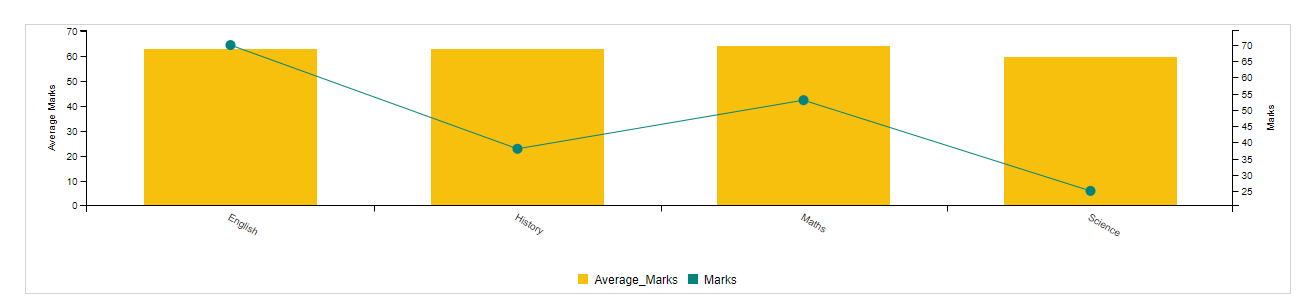
In the picture shown above, ‘marks’ and ‘diversity’ are the two tab buttons and our objective is to load the different charts on click of each of the tab buttons.
Steps:
1. Create an html page.
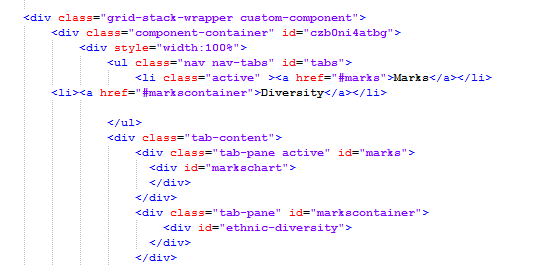
2. In the body of the page use the code as written below:
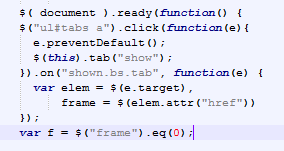
3. In the script tag of the page use following code:
 4. Used the C3 library to create the bar chart and pie chart. Similarly you can use any chart as per requirement.
Bind the chart to render on different div ids.
5. Final output will be something like shown in fig 1.1.
Refer the attached folder : Tab dashboard

Best Open Source Business Intelligence Software Helical Insight is Here