Web-based Ad Hoc Query and Reporting
Pentaho web-based ad hoc query and reporting is a capability that extends Pentaho Reporting to provide end-user self-service for report creation.
Make data easy with Helical Insight.
Helical Insight is the world’s best open source business intelligence tool.
How does Ad-Hoc Reporting work?
Web-based ad hoc query and reporting provides a browser-based wizard that allows end-users to create their own reports.
The wizard uses web services and components in the Pentaho platform to utilize metadata models that have been published from the Pentaho metadata editor.
Pentaho metadata allows the content of the reporting database to be presented to business users in familiar business terms.
Reports created by users use metadata queries to define the data that user wants to see.
These metadata queries are translated into SQL every time a report is run so any changes to the database are hidden from the users.
What are the tools to be used for Ad-hoc reporting?
1) Mondrian – PSW –Pentaho Schema workbench – OLAP cube creation
2) Saiku Analytics
Mondrian – PSW –Pentaho Schema workbench – OLAP cube creation
- It is a designer interface that allows you to create and test Mondrian OLAP cube schemas visually.
- The Mondrian engine processes MDX requests with the ROLAP (Relational OLAP) schemas.
- These schema files are XML metadata models that are created in a specific structure used by the Mondrian engine.
- These XML models can be considered cube-like structures which utilize existing FACT and DIMENSION tables found in your RDBMS.
- It does not require that an actual physical cube is built or maintained; only that the metadata model is created.
Features of PSW:
- High performance, interactive analysis of large or small volumes of information
- Dimensional exploration of data, for example analyzing sales by product line, by region, by time period
- Parsing the MDX language into Structured Query Language (SQL) to retrieve answers to dimensional queries
- High-speed queries through the use of aggregate tables in the RDBMS
- Advanced calculations using the calculation expressions of the MDX language
Saiku Analytics
- On-Line Analytical Processing (OLAP) is a category of software technology that enables analysts, managers and executives to gain insight into data through fast, consistent, interactive access to a wide variety of possible views of information that has been transformed from raw data to reflect the real dimensionality of the enterprise as understood by the user.
- OLAP functionality is characterized by dynamic multi-dimensional analysis of consolidated enterprise data supporting end user analytical and navigational activities (The OLAP Council)
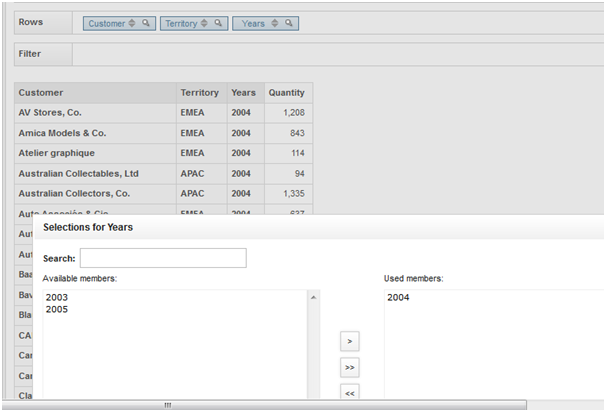
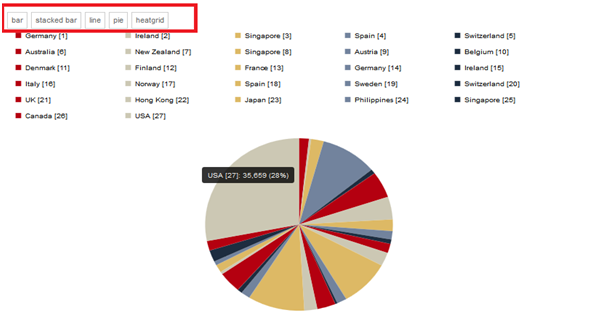
- By harnessing the power of OLAP, Saiku allows users to choose the measures and dimensions they need to analyse and “slice and dice” the data and drill into the detail to uncover relationships, opportunities and issues.
- The intuitive user interface lets users drill down and up, filter, pivot, sort, and chart against OLAP and In-Memory engines.
- Utilizing the Olap4J library, Saiku is the first application on the market to offer support for Mondrian’s Scenario feature allowing non destructive editing of query results, giving users the ability to adjust the figures and perform “what-if” analysis over their data.
- By harnessing the power of Mondrian, Saiku offers scalable in-memory analysis.
- Large amounts of data can be stored in memory in a distributed manner across the local network, offering greatly improved performance over large data warehouses as the aggregated data is retrieved from the network instead of reading from disk.
NOTE:
- Saiku Analytics for pentaho is a web-based Ad-hoc reporting tools.
- It’s a plug-in for pentaho. You can download and install from Penthao Market Place in Penthao Server.
Features of Saiku Analytics
- Drag & Drop Report-Design
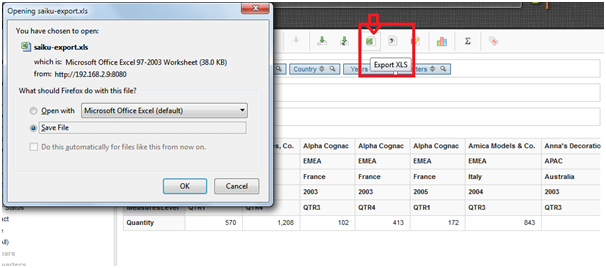
- Export to: PDF,CSV,XLS,CDA,PRPT
- Uses Pentaho Report Designer PRPT-Templates
- Grouping
- Aggregation
- Totals
- OpenFormula Support
Make data easy with Helical Insight.
Helical Insight is the world’s best open source business intelligence tool.
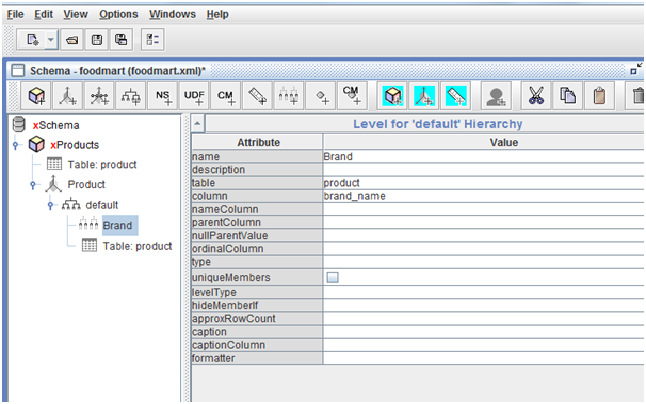
Working with PSW

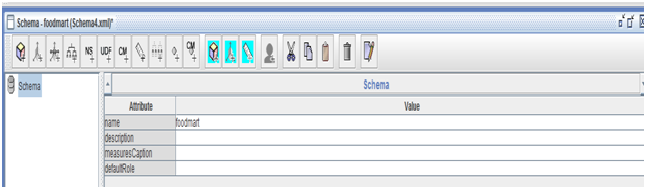
Schema

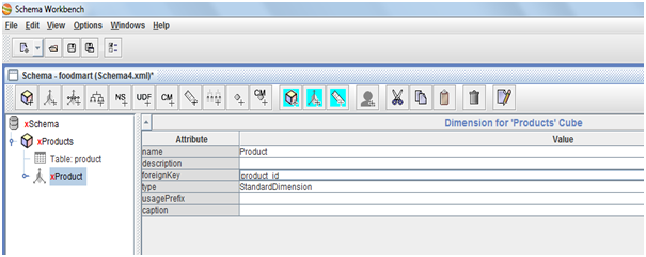
Dimension
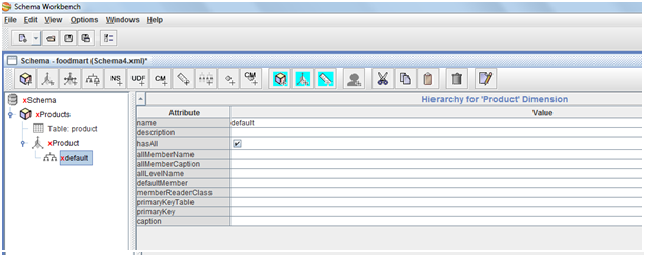

Level
|
Name and SKU Levels Attributes
|
||
|
name
|
Name
|
SKU
|
|
table
|
product
|
product
|
|
column
|
product_name
|
SKU
|
Measure
|
Product and Class Numbers Attributes
|
|
name
|
product number
|
class number
|
|
aggregator
|
distinct-count
|
distinct-count
|
|
column
|
product_id
|
product_class_id
|

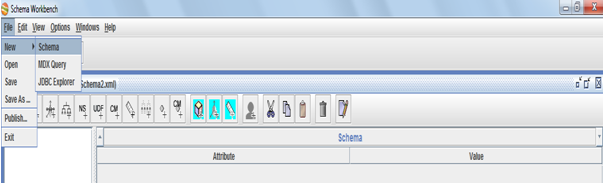
Save your Schema
Click on File > Save As. Choose a path and a name for your schema.
Make data easy with Helical Insight.
Helical Insight is the world’s best open source business intelligence tool.
Schema
Dimension
Level
|
Name and SKU Levels Attributes
|
||
|
name
|
Name
|
SKU
|
|
table
|
product
|
product
|
|
column
|
product_name
|
SKU
|
Measure
|
Product and Class Numbers Attributes
|
|
name
|
product number
|
class number
|
|
aggregator
|
distinct-count
|
distinct-count
|
|
column
|
product_id
|
product_class_id
|
Save your Schema
Click on File > Save As. Choose a path and a name for your schema.
Make data easy with Helical Insight.
Helical Insight is the world’s best open source business intelligence tool.

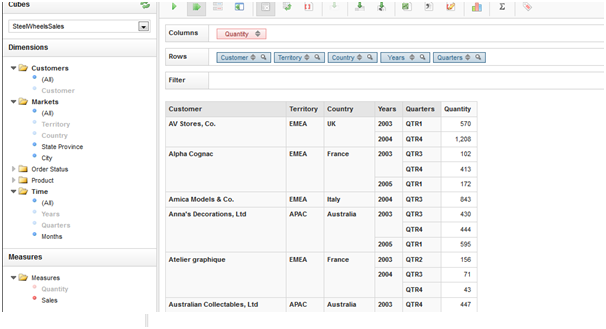
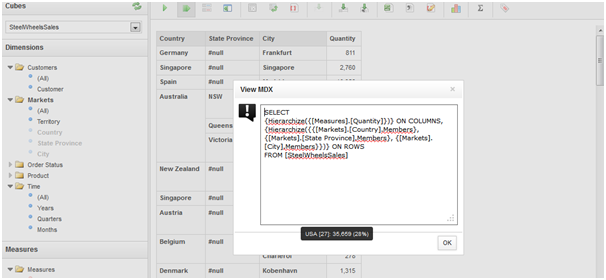
2. Drag and drop Dimension and measures to the Columns and Rows

7. MDX Query Analysis
- Saiku engine internally generates MDX queries.
- Also pentaho mondrain and sql log files we can find in the installation folder.
- For doing this we need to enable the log files.
- Mondrian engine internally converts the MDX queries to SQL queries.

Best Open Source Business Intelligence Software Helical Insight is Here
I have installed Penatho 5.0.1 and Pentaho Schema Workbench 3.6.1. When I am trying create cube in Schema Workbench, it is not getting tables from Impala/Hive. Whether we can create cude in Schema Workbench 3.6.1 using impala jdbc driver?
Can you help to do the same above steps for Impala as data source?? I am finding some tough time on it.