Prerequisites: Jasper Studio 6.4.0
Database: foodmart
In this blog we will discuss how to wrapping the label text for HTML5 pie chart in Jasper reports.
Make data easy with Helical Insight.
Helical Insight is the world’s best open source business intelligence tool.
Step 1: Create a Report with sample hard-coded data with long text.
Step 2: Add Summary band in the report.
Step 3: From the Palette tab drag and drop Pie chart element.
Step 4: Double click on the pie chart, in the label expression give the label name and in the value expression give the value either it could be sum or count.
Step 5: Now run the report in the studio using Preview button, Then the label text has crossed the plot border as shown below.
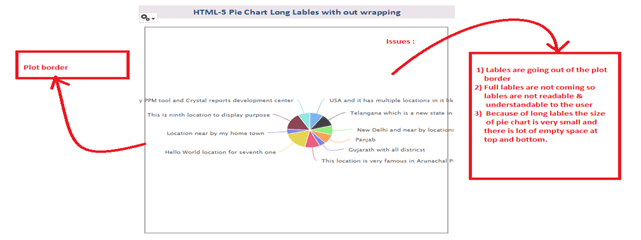
Step 6: So we will avoid the below problem using below properties.
- Right Click on the chart -> Click on Edit Chart Properties
- Click on Advanced Properties button
- Click on Add button add below the property
Property name : plotOptions.pie.dataLabels.style.width
   		Property Value : 130
Styles for the label. Defaults to {"color": "#606060", "fontSize": "11px"}.
Property Name : plotOptions.pie.dataLabels.x
    		Property Value : 3
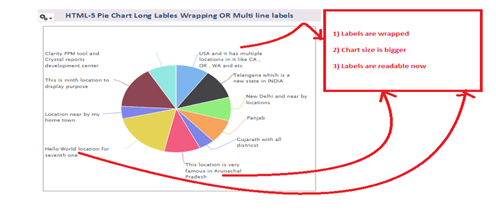
Step 7: Run the report and see the output.
In case if you have any queries please get us at support@helicaltech.com
Thank You
Eswar
Helical IT Solutions Pvt Ltd

Best Open Source Business Intelligence Software Helical Insight Here
A Business Intelligence Framework
Best Open Source Business Intelligence Software Helical Insight is Here