In Bugzilla, Graphical reports encompass bar,line and pie charts,serving various purposes.For instance,when a user needs to identify the Severity of the bugs for the particular component and intends to visualize this data graphically,they have two available options to choose from :
Severity on the X-axis
Component on Y-axis
Step 1- Login to the Bugzilla account with valid credential and click on Reports tab.
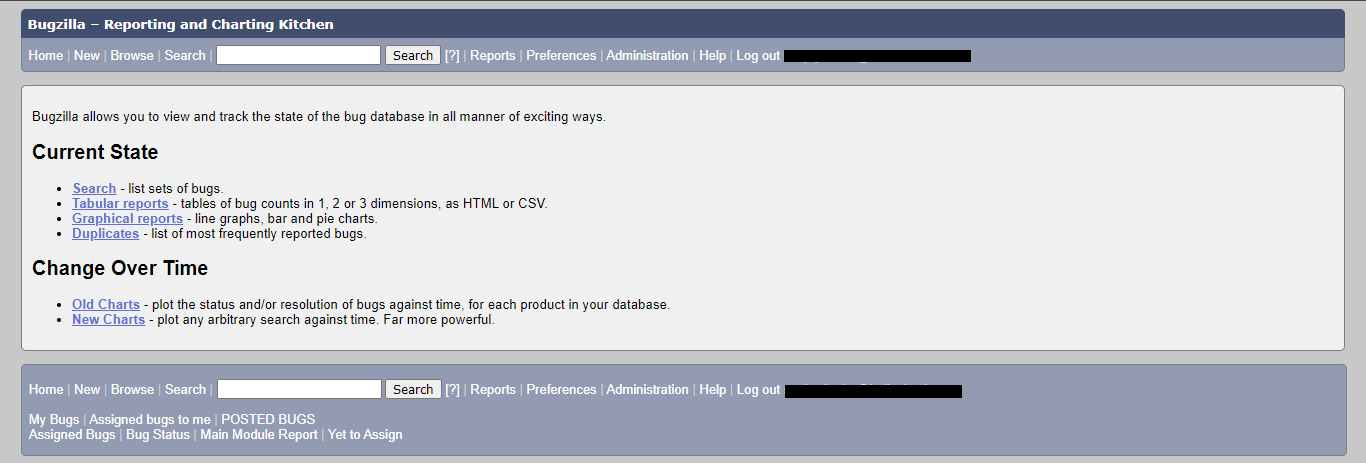
Step 2- Click on the Graphical reports in the Current State section.
Step 3- Select the vertical and horizontal axis from drop down list.You can select multiple tables also if required.For.eg.Here we are generating report with Severity of the bug vs Component.

Step 4- Provide the other details such as Product,Component,Status and Resolution.
Step 5- After providing all required details click on Generate report.You will see the generated report with number of bugs in vertical axis and Severities in horizontal axis.Count of the bug will show according to severity.
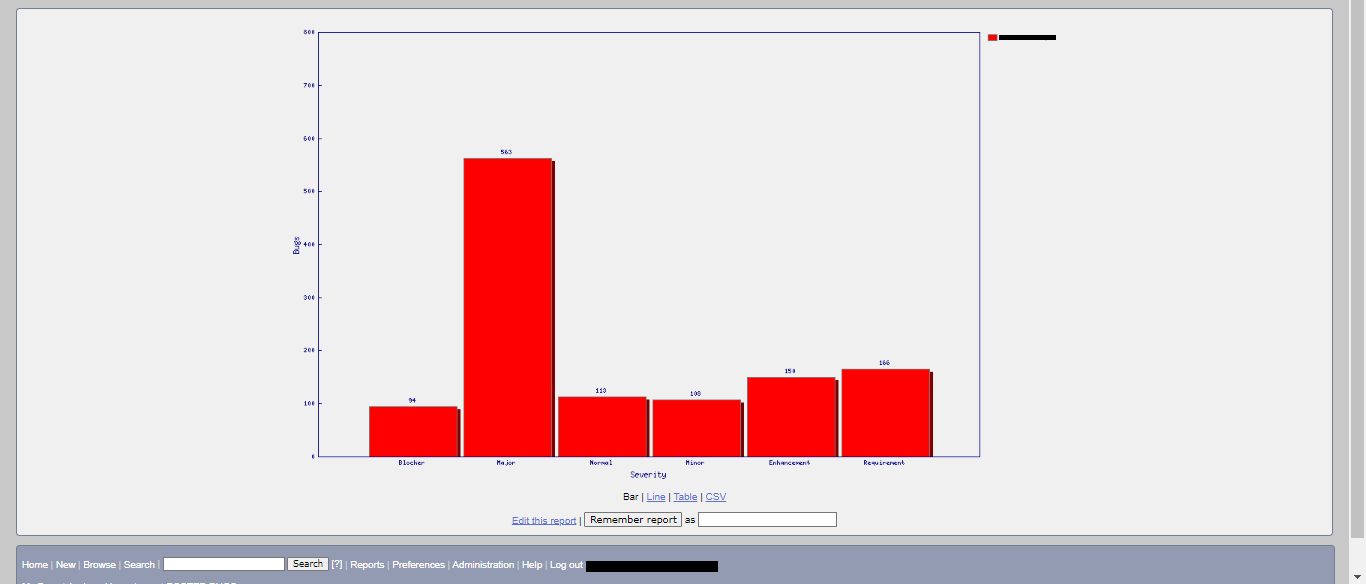
Steps 6- To save this report for future use ,provide the report name in ‘Remember report as field’ and click on Remember report hyperlink.
In conclusion, graphical reports,comprising bar,line and pie charts,offer valuable insight for users.Specifically above report example highlight the severity of bugs for the particular components,user can seamlessly represent this data through two available options.By using this graphical charts user can enhance the clarity and effectiveness of bug severity analysis.
Thank You
Kedar Ingale
Helical IT Solutions