Power BI is full of amazing pre-built visualizations, but your business is unique, and so are your data needs.Though we can import custom visualization, sometimes we might not find the exact required visual.So, one can create their own custom visualization based on the requirements.Custom Visual is nothing but a mini website hosted by Power BI Service
Steps to be followed for creating custom visualization
- Install node.js
Reference link : https://nodejs.org/en/download/
2. Install Power BI visual tools. For that, open command prompt and type the below code
npm install -g powerbi-visuals-tools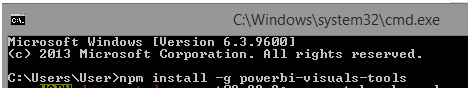
3. Create and install a certificate. Type the below code in command prompt
pbiviz --install-cert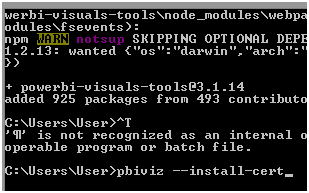
4. Refer the below blog if any errors while installing certificate
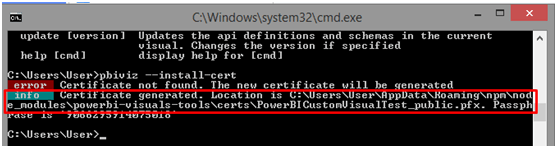
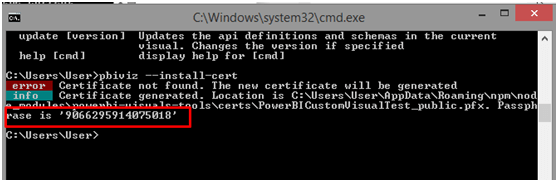
5. Copy the path of the certificate from the info provided after succesfull installation of the certificate
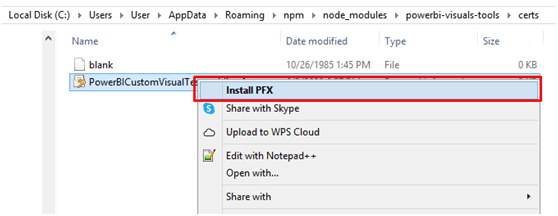
6. Go to the mentioned location,right click on the pfx file I.e. PowerBICustomVisualTest_public.pfx and click on ‘Install PFX’ as shown
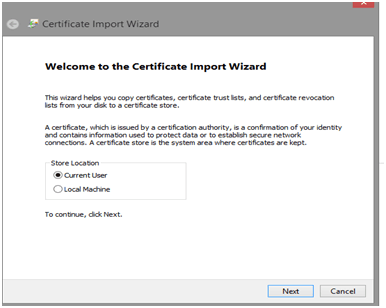
7. Then, it opens a report Wizard, choose ‘Current User’ and click Next
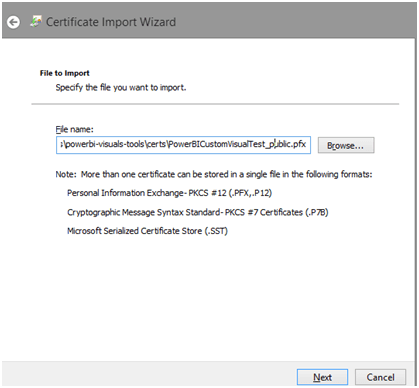
8. Leave the path as is and again click on Next
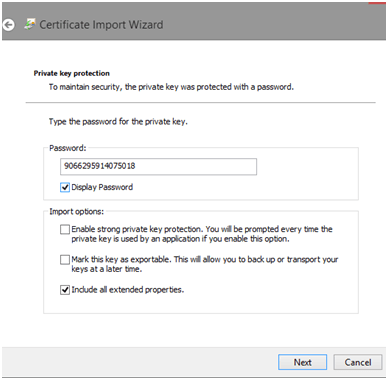
9. Copy the paste pass phrase from the info provided after succesful installation of certificate and click next.
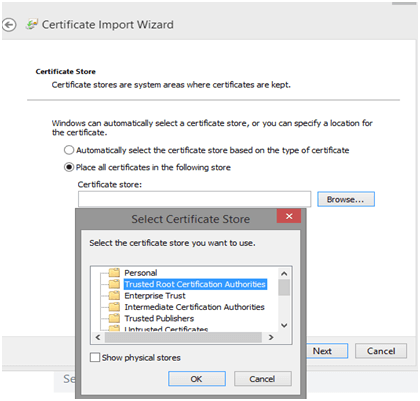
10. Now, select ‘Place all certificates in the following store’ and choose ‘Trusted Root Certification Authorities’ folder
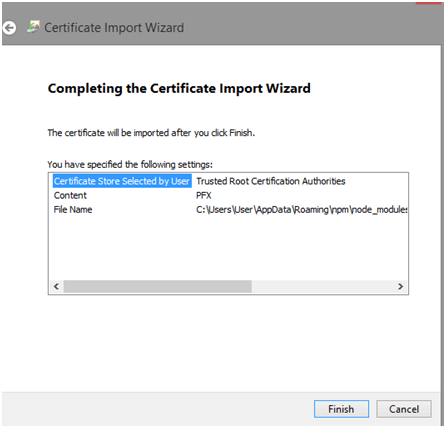
11. Click on Finish
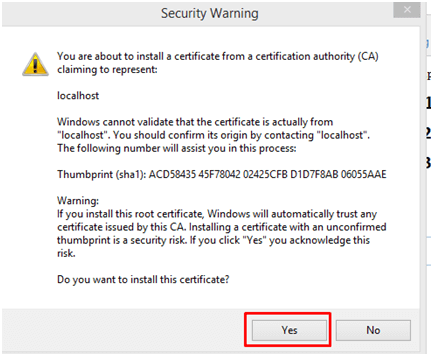
12. Finally click on ‘Yes’
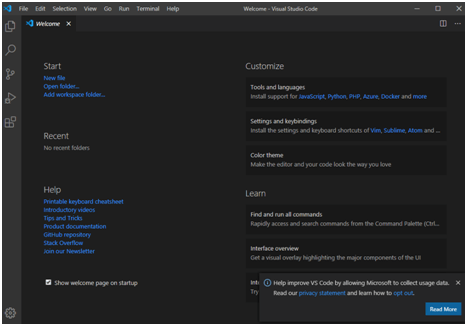
13. Next step is to ‘Install an IDE’. IDE is of personal choice. Here we are using visual studio code.
14. Download Visual Studio Code from “https://code.visualstudio.com/download” and install it.
15. Overview of Studio is as shown
16. Now, we need to create a project to write our custom code.
17. To create a project, go to command prompt and navigate folder name where you want to create the project.
18. Then, type the below command to create visual in the project created
pbiviz new barchart i.e. pbiviz new ‘Visual Name’19. This command creates the new visual and installs the required packages.
20. To verify, you can navigate to the folder where you created the visual and then you can see the source code
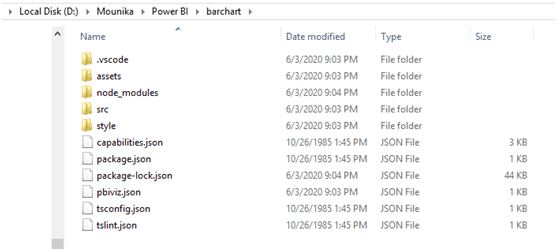
21. To test and preview the visual, navigate to visual created i.e. barchart and then type the below command.
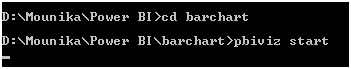
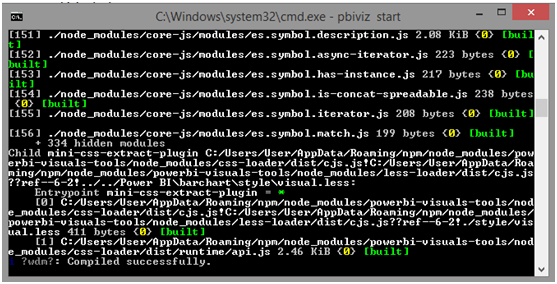
Note: This command should be running in the background as long as we use the visual

Best Open Source Business Intelligence Software Helical Insight is Here