Gantt chart through Widget Pro Component in Jaspersoft
Widgets Pro elements are rendered as Flash objects that are embedded in the HTML and PDF output. When a report containing Widgets Pro element is exported in a format other than HTML or PDF, the space used by the element remains blank. To view Maps, Charts, and Widgets Pro elements in HTML output, make sure Flash is installed and enabled on your browser. To view Maps, Charts, and Widgets Pro elements in PDF output, be sure to use a Flash-enabled PDF viewer such as Adobe Reader 9.
Make data easy with Helical Insight.
Helical Insight is the world’s best open source business intelligence tool.
Prerequisite:
- Jasperstudio pro 6.0 (any available)
- Jasperserver 6.2(This blog is specific to this version)
- At the tab Window>Preferences>Jaspersoft Studio>Properties add a new property with Property Name “com.jaspersoft.jasperreports.fusion.widgets.render.type” and Value “html5″[ incase the report doesn’t show up]. Set above property to avoid the error message which will appear after some minutes in Preview tab after running the report containing the widget pro component.
- In the jasperserver properties file at location: <Jaspersoft>\jasperreports-server-6.2.0\apache-tomcat\webapps\jasperserver-pro\WEB-INF\classes\jasperreports.properties. Change the render.type as flash for gantt chart widget to render in your jasperserver.
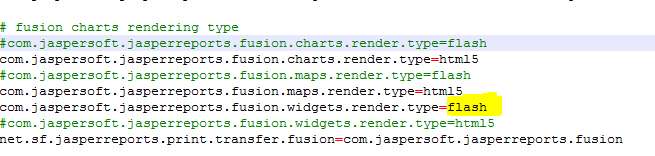
Note: You don’t need to set this property in jasperserver:6.3.0
Steps Involved in Created the gantt chart using widget pro option in jasperstudio:
- Create Blank report.
- Drag the gantt chart option from Componentspro->widgets pro-> Gantt chart.


- In main report query write the query which is going to have all the necessary data needed to be populated In the gantt chart.
- The Gantt Chart is the most complex widget or chart, with its data defined by up to four different datasets. The following figure shows the main components of a Gantt chart:
Category Set: Its going to be the different categories under which the task data is going to be populated. E.g We can categorise the time period in different months.
Process set: Process Set consists of different values on y axis which simply means different subjects or areas for which the data in form of task is going to be visualized in the chart.
Process is unique to its type. E.g P1, P2, P3, P4…. etc
Task Set: There can be more than one task in every process. Thus different tasks come under the each process, as the per the available data. E.g P1.T1, P1.T2, P2.T1, P3.T3, P3.T2 etc. Unlike process the task can be same in different process.
Refer the document on ireport widget pro for the basics of gantt chart.
- Configuring the properties of widget pro:
As shown in the figure below add different categories in the category set of the gantt chart.

- Configure the dataset in the gantt chart as shown in the data given below:


Make data easy with Helical Insight.
Helical Insight is the world’s best open source business intelligence tool.
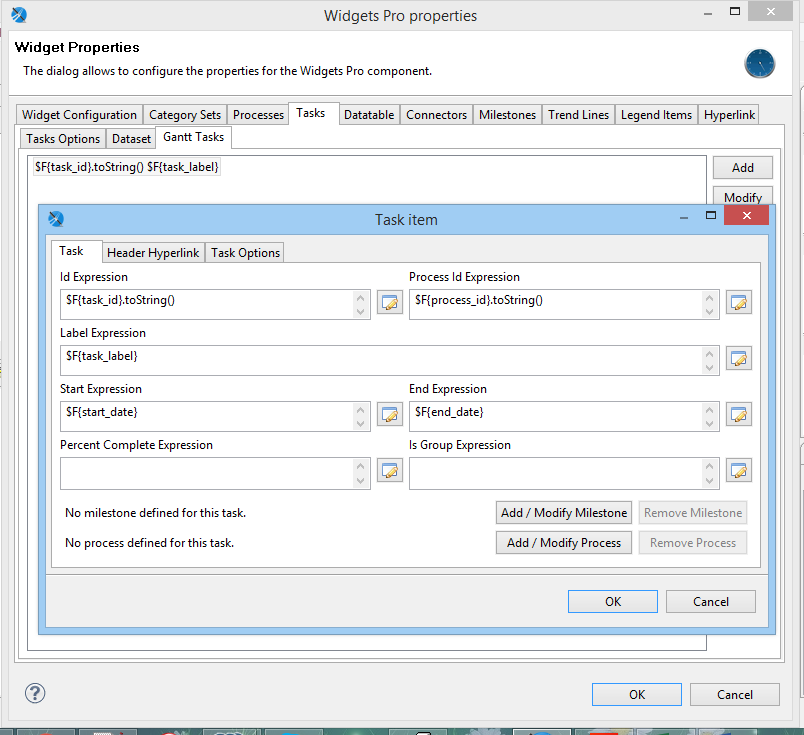
Note: Don’t forget to add the process id for each task added.
- Configure the tasks in the chart as shown in the given screenshot:
- Save the report and publish on server. You”ll be able to get the desired gantt chart.
Thankyou
Nisha Sahu

Best Open Source Business Intelligence Software Helical Insight is Here