Table Expansion
Table Expansion refers to the ability of a table to open up an extra block and display additional data about the selected row.
For example, a table might be showing the details of the different departments in a company and when a department is selected, a new row “opens up” or “expands” to show another table containing the names of the employees in that department.
ScreenShot 1:

Here you can see that the list of departments is given in a tabular form along with its department id.
ScreenShot 2:
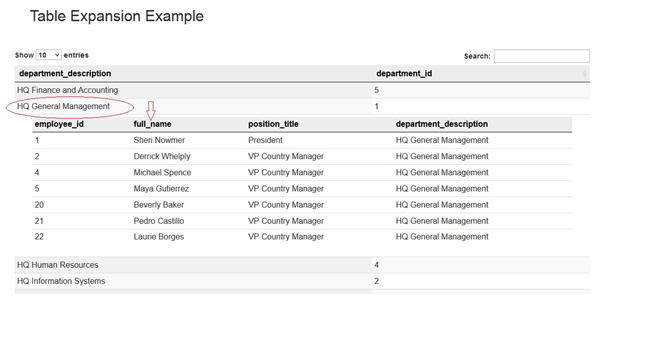
Here when the user clicks on the department name (“HQ General Management”), a new row opens up and gives another table containing the details of the people working in that department.
How is it Done?
There are 3 components created to make this type of table possible
- Outer Table (tabularChart)
- Inner Table (innerTabularChart)
- Custom Script (runScript)
The first two components are alotted <div> tags in the .html file while the script is needed to display the Inner Table inside the outer table at the desired location.
The Outer Chart is created by calling “chart 1” from the tabular.efwvf file. For the creation of the initial table we have used a hard coded SQL query in dataConn.efwd file since this is a test example.
We add a “on click()” function to the “$(document).ready(function () { /*script*/});
This “on click”function recognises where the click is occuring, i.e- on which department name. This deparment name is then passed onto the “chart 2” creation script where the new table (Inner Table) is dynamically created by fetching the data from the database, based on the “department name”.
Here, the “opened row” is also alloted a new id and class name, making it identifiable for later references.
Now this second table is placed at the <div> tag with the id “innerTabularChart”, but it is not made visible.
Here is the tricky section, the code doesnt display the Inner Table on the screen but it is present in the memory awaiting command that will display it on the screen.
At this point, the Custom Script is executed. The job of this script is to “Clone” (using .clone()) the data held in the <div> tag called “innerTabularChart” and display it in the “opened up” row.
Once the inner table is displayed inside the opened/expanded row, it is VERY important to empty the initial <div> tag of the .html file so that the new table doen not get displayed as a drill-down chart.
After the “innerTabluarChart” wiped clean, all the components are updated. Now we finally get the result of expanding tables as seen in the above screenshots.
Important :
If user wishes to add more than one table in the “expanded” row, It can be done by splitting the <div id=”innerTabularChart”> tag and writing the appropriate custom script for displaying the second table.
html code:
<div class=”row”>
<div class=”container”>
<div class=”col-sm-11″ style=”padding-left:30px;”>
<h2 id=”heading”>Table Expansion Example</h2>
</div>
</div>
</div>
<br>
<div class=”container”>
<br>
<div class=”row”>
<div class=”col-sm-12″ id= “tabularChart”></div>
</div>
</div>
<br>
<div class=”col-sm-12″ id=”innerTabularChart” style=”display: none;” ></div>
<script>
//Custom script
</script>

Best Open Source Business Intelligence Software Helical Insight is Here