Requirement: In the Power BI report I have a Date dimension and Employee fact tables. In report I have added single select Year slicer and a column chart which should show Region wise employee terminations count. Current report will look like below
Make data easy with Helical Insight.
Helical Insight is the world’s best open source business intelligence tool.
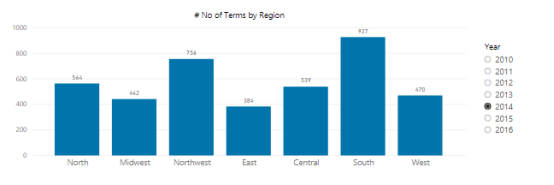
As Year is single select, No of terms by Region chart showing data for only selected year. But I want the previous year data along with the selected year in chart
Ex: In the above image, year 2014 is selected so chart should show data for 2013 and 2014 years
Solution:
- In the Power BI report we have Date dimension and Employee fact tables.
- Date dimension and Employee fact table are related with a date column
- Create a new calculated table using Date dimension to get the unique Year values
- Use the column created in above step in Year slicer I.e Earlier we used year column from Date dimension as slicer but now we should use the new year column from ‘YearKey’ table
- Create a new measure in Date dimension. This measure will help us to get the status of current selected and previous year
- Use the above created measure as a filter on the visual. Expand the filters, select the visual and drag the measure into filters. Apply filter as 1 for the measure
- Use the Year column from the ‘Date’ dimension into the legend of the chart
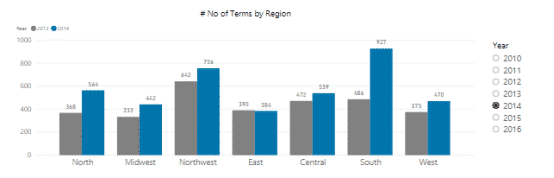
- Now we can see that chart will show data for the selected year and previous year
Table Expr: YearKey = DISTINCT('Date'[Year])
Measure Expr: Measure PrevYear Check = IF(MAX('Date'[Year])>(MAX(YearKey[Year])-2) && MAX('Date'[Year])<=MAX(YearKey[Year]),1,0)
We are using Year column from YearKey in slicer so MAX(YearKey[Year]) will give the selected value and we will evaluate this for each year in Date dimension.
Consider we selected 2014 year in slicer and expression evaluates for each row and we can see the result of the measure
MAX('Date'[Year]) is 2010 > (2014-2) -> FALSE && 2010 <= 2014 -> TRUE :- 0
MAX('Date'[Year]) is 2011 > (2014-2) -> FALSE && 2011 <= 2014 -> TRUE :- 0
MAX('Date'[Year]) is 2012 > (2014-2) -> FALSE && 2012 <= 2014 -> TRUE :- 0
MAX('Date'[Year]) is 2013 > (2014-2) -> TRUE && 2013 <= 2014 -> TRUE :- 1
MAX('Date'[Year]) is 2014 > (2014-2) -> TRUE && 2014 <= 2014 -> TRUE :- 1
MAX('Date'[Year]) is 2015 > (2014-2) -> TRUE && 2015 <= 2014 -> FALSE :- 0
MAX('Date'[Year]) is 2016 > (2014-2) -> TRUE && 2016 <= 2014 -> FALSE :- 0

Make data easy with Helical Insight.
Helical Insight is the world’s best open source business intelligence tool.
Selected Year: 2014
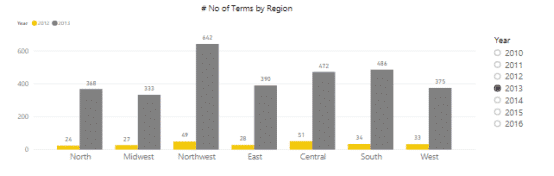
Selected Year: 2013
In case if you have any query please get us at support@helicaltech.com
Thank You
Ramu Vudugula
BI Developer
Helical IT Solutions Pvt Ltd

Best Open Source Business Intelligence Software Helical Insight Here
A Business Intelligence Framework
Best Open Source Business Intelligence Software Helical Insight is Here