Prerequisites:
- Jasper Server
- Jaspersoft Studio
- Sample food mart database
Make data easy with Helical Insight.
Helical Insight is the world’s best open source business intelligence tool.
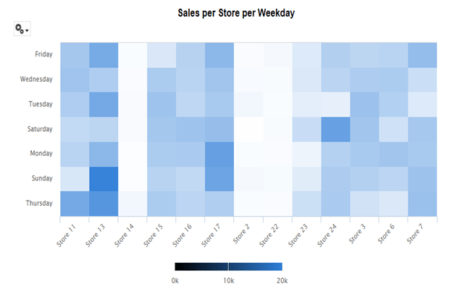
Report Requirements: Creating heat map of store wise sales on a weekday and Show customized tooltip.
Steps:
Created a sample query using food mart database of jasper server.
Query:
select store_name,the_day,round(sum(store_sales),0) Sales from sales_fact_1997 sf
join store st on sf.store_id = st.store_id
join time_by_day td on td.time_id = sf.time_id
group by store_name,the_day
Open jaspersoft studio and create a report, add the query in the main dataset, Drag the HTML5 charts on to the canvas and select heatmap, Add the data configuration, select store on category, day on series and sales as measure.
Preview the report and deploy it in the server. It will look like below.
Hover on a particular element to check the sales on a store on a weekday. Here for store 13 on Sunday how much sales happened? To check this hover on store 13 and on Sunday. Below is the picture
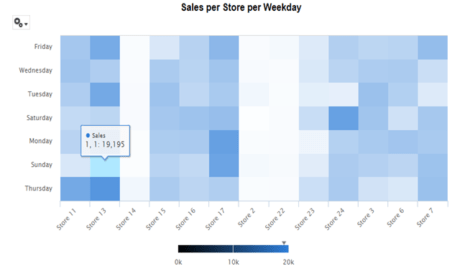
See the tooltip, it is showing as 1,1: 19,195 instead of showing store 13 and Sunday. Actually, a tooltip will take the coordinates of those elements and display the value.
Make data easy with Helical Insight.
Helical Insight is the world’s best open source business intelligence tool.
Now we have to change this to “Total Sales of Store 13 on Sunday: 19,195”
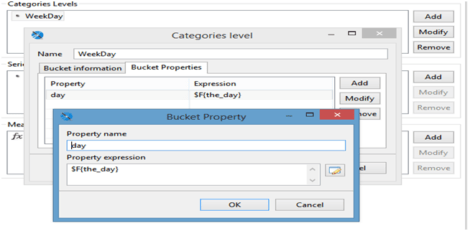
Open report in a studio, click on chart properties and open chart data configuration, Edit category and add bucket properties as below.
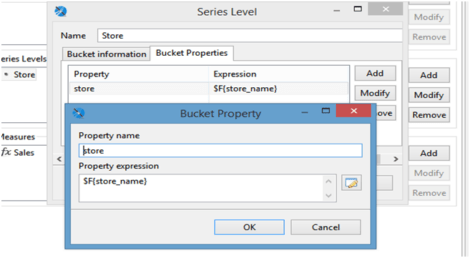
Edit series and add bucket properties as below
Add those bucket properties to measure advanced properties as below
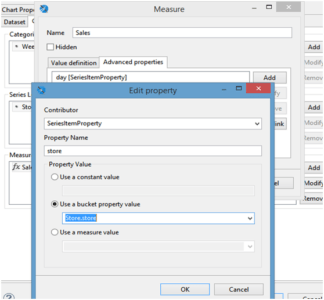
Add the properties for both category and series in advance properties of a measure, Now click on chart advanced properties and add new tooltip property like below

point.store takes the value from the bucket property store, point.day takes the value from bucket property day and point.value is the measured value. Deploy the report in the server and render the report.
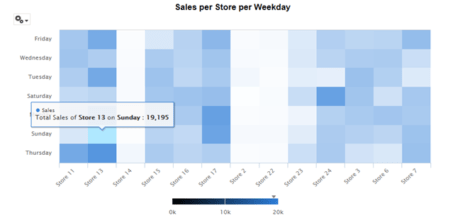
See In above Image tooltip was showing like “Total Sales of Store 13 on Sunday: 19,195” as mentioned earlier.

Best Open Source Business Intelligence Software Helical Insight is Here
A Business Intelligence Framework
Make data easy with Helical Insight.
Helical Insight is the world’s best open source business intelligence tool.
In case if you have any queries please get us at support@helicaltech.com
Thanks,
Ramu Vudugula,
Adding Customized Tool Tip in High Charts Heat Map in Jaspersoft Server Can we add chart customizers to Jasper Server customized tooltip in heatmap jaspersoft heat map high charts HTML5 charts-Customizing tooltip formatting in Jasper Studio jasper report line chart example jasper studio jaspersoft jaspersoft server tooltip