Creating CrossTab In Helical Insight using EFW Method
This blog will teach you how to create Cross Tab in HDI (Helical Dashboard Insights).
CrossTab uses PivotTable.js.Which is a JavaScript Pivot Table Library with drag and drop functionality. ‘PivotTable.js’ basic function is to turn a data set into a summary table and then optionally add a true 2-d drag’n’drop UI to allow a user to manipulate this summary table.
Main functions defined in ‘PivotTable.js’ is pivotUI()and is implemented as jQuery plugins.
PivotUI() takes 3 parameters :
1) Input : input is an array of objects, an array of arrays, a function or a jQuery object referencing a table.Here we are using Json Data as a input.
2) Option : is an object with the following keys:
- aggregators: dictionary of generators for aggregation functions in dropdown, defaulting to common aggregators.
- rows: array of strings, attribute names to prepopulate in row area, default is [ ]
- cols: array of strings, attribute names to prepopulate in cols area, default is [ ]
- vals: array of strings, attribute names to prepopulate in vals area, default is [ ] (gets passed to aggregator generating function)
- aggregatorName: string, aggregator to prepopulate in dropdown (key to aggregators object), default is first key in aggregators .
3) Locale: is a string defaulting to en which controls the default locale for things like number formatting and error messages. Regardless of this setting, you can still override the default aggregators (which control number formatting) and error message strings. If this is set to something other than en you will have to load a locale-specific ‘language pack’ which creates this locale object before calling pivotUI().
For adding the Cross Tab in the HDI following steps should be followed:
1) EFW file: EFW contain the Title, author, description, Template name, visibility of the Dashboard.
2) HTML File:HTML file name should be the same that specified in the EFW file under the Template Section.
In HTML File On Top we specify links of the external link.
Here we are using the ‘PivotTable.js’ as external Library and it specified in the HDI as below:
<scriptsrc="getExternalResource.html?=CrossTab/PivotTable.js"></script>
We have to declare one CrossTab component in “CrossTab.html” file and in this component we need to provide the link of the file where the CrossTab chart property is defined.
3) EFWD File:EFWD file contain the Data Source Connection Properties such as connection id and connection type.It also contain Url of the connection to the database, User name and Password to the Database.
The DataSource Details used in our demo is shown as below:-
<DataSources>
        <Connection id="1" type="sql.jdbc">
           <Driver>com.mysql.jdbc.Driver</Driver>
           <Url>jdbc:mysql://192.168.2.9:3306/sampledata</Url>
            <User>devuser</User>
            <Pass>devuser</Pass>
        </Connection>
    </DataSources>
Data Map contains Map id and connection and connection Type. Map id is same as that specified in the EFWVF. Query for the Data Map and the Parameter to be used is specified in the Tags and Parameter in the Tags.
<DataMap id="2" connection="1" type="sql" >
       <Name>Query for CrossTab Component </Name>
		<Query>
			<![CDATA[
					SELECT distinct r.precinct,cd.candidate,sum(fact.votes) votes
                                        FROM Voting_Summary as fact,region as r,contest as ct,candidate as cd
                                        where fact.region_id=r.region_id and
                                        fact.contest_id=ct.contest_id and
                                        fact.candidate_id = cd.candidate_id
                                        group by ct.contest,r.precinct,cd.candidate;

			]]>
              </Query>
</DataMap>
4)EFWVF File :-
In EFWVF file we first set the chart id the chart we set the chart properties. For Pie Chart we set the chart Properties between the tags. The properties such as Chart name, Chart type, Chart Data Source.
In Script we set the CrossTab as Below :
<script>
<![CDATA[
$(function(){
$("#chart_1").pivotUI(data,
{
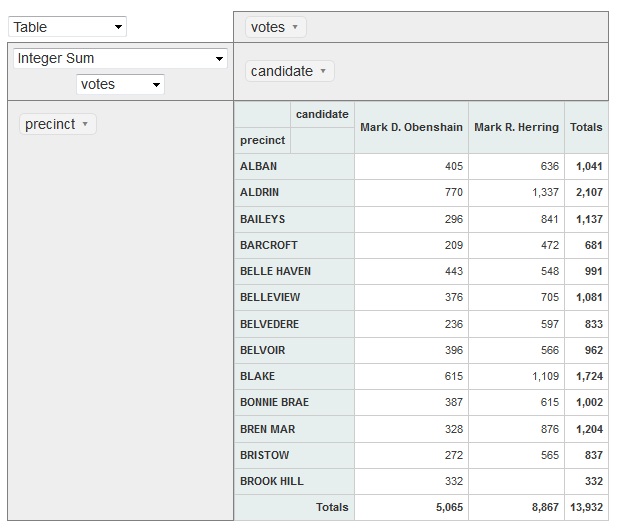
rows: ["precinct"],
cols: ["candidate"],
aggregatorName: "Integer Sum",
vals: ["votes"] ,
}
);
});
]]>
</script>
By following these we are able to see the output which is as follows:
-By
Nitin Uttarwar
Helical It Solution

Best Open Source Business Intelligence Software Helical Insight is Here