This blog explains the process of creating a CDE dashboard in pentaho using CCC charts component.
Make data easy with Helical Insight.
Helical Insight is the world’s best open source business intelligence tool.
Prerequisites:
- Foodmart database
- Pentaho 6.0.1.0.386
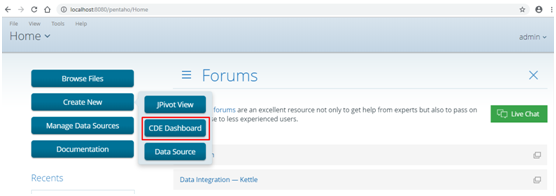
- Click on Create New –> CDE Dashboard
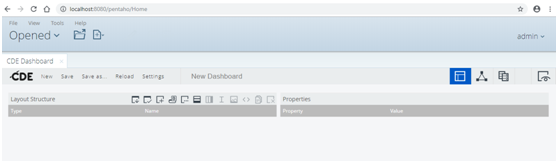
- CDE dashboard panel is as shown
- There are 3 panels in CDE dashboard which are present in the right corner of CDE dashboard panel.
- Layout Panel
- Component Panel
- Datasources Panel
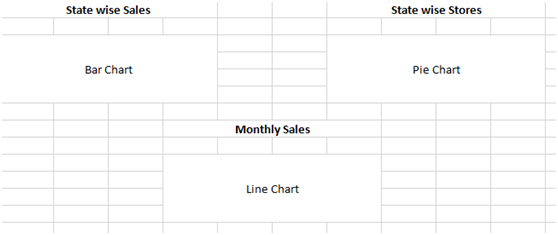
- Creation of layout is the first step.Based on the requirement, create a layout i.e. we need 2 rows and 2 columns in the first row.
- Name: name of the row which acts as HTML id too.
- Height: height of the row
- Name: name of the column which acts as HTML id too
- Height: height of the column
- Extra Small,Small,Medium and Large devices: bootstrap parts which makes the configuration of the columns simple.
- Twelve columns of size 1 (12×1)
- Two columns of size 6 (2×6)
- Three columns of size 4 (3×4)
- One column of size 8 and one column of size 4 (8+4)
- Next, we need to add 3 data sources (sql over sqljdbc) with 3 queries each for each chart.
- For bar chart, we need state wise sales data.
- The properties to be given in data source are as shown
- Similarly, add data sources for pie chart and bar chart.
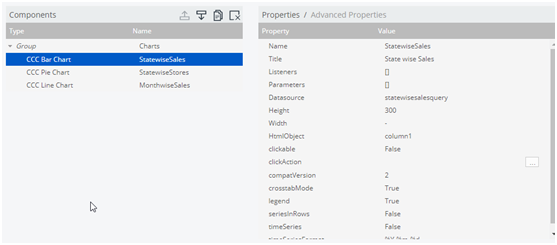
- Add required chart components in component panel under charts section i.e. CCC Bar Chart, CCC Pie Chart and CCC Line Chart.
- Name: name of the chart component
- Title: title of the chart component
- Height: height of the chart component which should be less than the height of the column component into which chart is placed.
- HTML Object: name of the column/row in the layout section depending on the location of the chart component
- Datasource: Specify the datasource created.
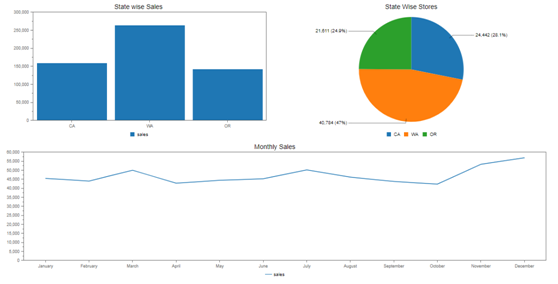
- Save the dashboard and preview.
Below is the dashboard to be created in pentaho using CDE.
Procedure to be followed:

It is used to create layout of the dashboard where we specify the number of columns, rows and placement of them.

It is used to add components required like tables, text boxes, charts etc.

It is used to add data source required.
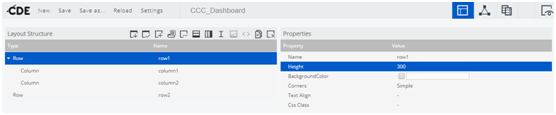
Mandatory properties of row to be filled
Make data easy with Helical Insight.
Helical Insight is the world’s best open source business intelligence tool.
Mandatory properties of a column to be filled:
Make data easy with Helical Insight.
Helical Insight is the world’s best open source business intelligence tool.
The columns in a row must occupy 12 spans, such that in a single row you could have the following sample configurations:
Properties of column used is as shown
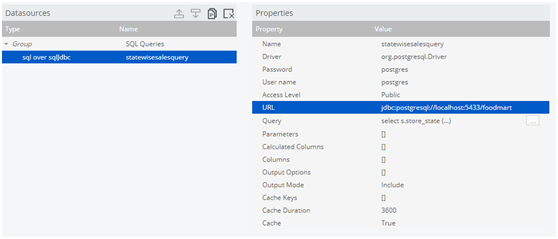
Query for bar chart:
select s.store_state,sum(f.store_sales) sales
from sales_fact_1997 f
left join store s
on f.store_id=s.store_id
where s.store_country='USA'
group by s.store_state
Driver : org.postgresql.Driver
Password : postgres
User name : postgres
Access Level : public
URL : jdbc:postgresql://localhost:5433/foodmart
Query for Pie chart:
select s.store_state as State,count(store_name) as Stores
from sales_fact_1997 f
left join store s
on f.store_id=s.store_id
where s.store_country='USA'
group by s.store_state
Query for Line chart:
Select a.Month,a.Sales
from
(select t.the_month as Month,t.month_of_year,sum(f.store_sales) as Sales
from sales_fact_1997 f
left join time_by_day t
on f.time_id=t.time_id
where t.the_year=2012
group by t.the_month,t.month_of_year
order by t.month_of_year) as a
Mandatory properties of a chart components to be filled:


In case if you have any queries please get us at support@helicaltech.com
Thanks,
Mounika Pulimamidi
BI Developer
Helical IT Solutions Pvt Ltd

Best Open Source Business Intelligence Software Helical Insight is Here