A BI solution will help an insurance company to get a holistic 360 degree view of customers, issues faced. Helical has got immense experience in developing BI solution in Property and casulaty insurance domain. Having built more than 50 reports, 20 dashboards, geographical dashboard, adhoc reports and OLAP cubes, these BI solution can be used across many different departments like underwriting, claims, billing, reinsurance, insurance etc.
Make your data with Helical Insight.
Helical Insight is the best business intelligence tool for the Property and Casualty Insurance Domain.
Below present are snapshots of some of the reports dashboard developed by us for client.
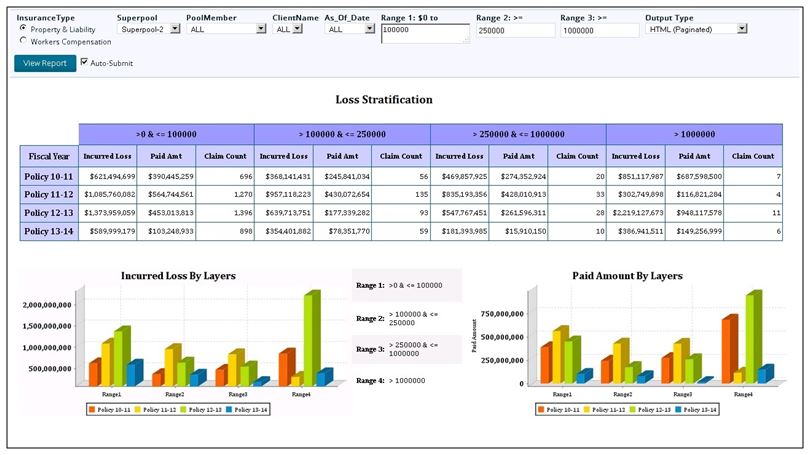
Loss Stratification
Description
This report includes stratification of total incurred with claim count within each stratum. This report includes the ability to define the bands ($0-$100K, $100K-$250K, etc.) to meet your needs.
Purpose
This information is useful in reviewing severity patterns. For example, we see in this report that approximately 60-65% of claim count is generated by losses valued at $1,000 or less. Loss stratification provides information that can be used in several ways. It is an important consideration in insurance program design – retentions, limits, etc. And, this report is also useful in setting severity reduction goals and monitoring performance.
loss stratification report
Loss Triangle
Description
A table of loss experience showing total losses for a certain period at various, regular valuation dates, reflecting the change in amounts as claims mature. Older periods in the table will have one more entry than the next youngest period, leading to the triangle shape of the data in the table. Loss triangles can be used to determine loss development for a given risk.

Loss Triangle Report
Large Loss Report
Description
This report provides detailed information on individual claims. It allows selection of claims over a certain threshold.
The amount of detail shown on this type of report can be completely customized to meet each client’s needs.
Make your data with Helical Insight.
Helical Insight is the best business intelligence tool for the Property and Casualty Insurance Domain.
Purpose
By isolating claims over a chosen dollar amount, clients are able to focus upon claims making the greatest contribution to total incurred. Uses include claim reviews with administrators, insurance submissions, actuarial analysis and focusing operations staff on opportunities such as lost time reduction.

large loss report
Open Claims
Description
These reports can provide a simple listing with relatively little detail or much more complete information for specific claims.
Purpose
It is often valuable to focus specifically on open claims. We have worked with clients to develop a number of approaches and reports to address this need. Often the focus is to mitigate lost time and close claims. Most effective claim management programs include reinforcement of this objective to both operations staff and claim administrators.
Examples provided here show all open claims, open claims with total incurred
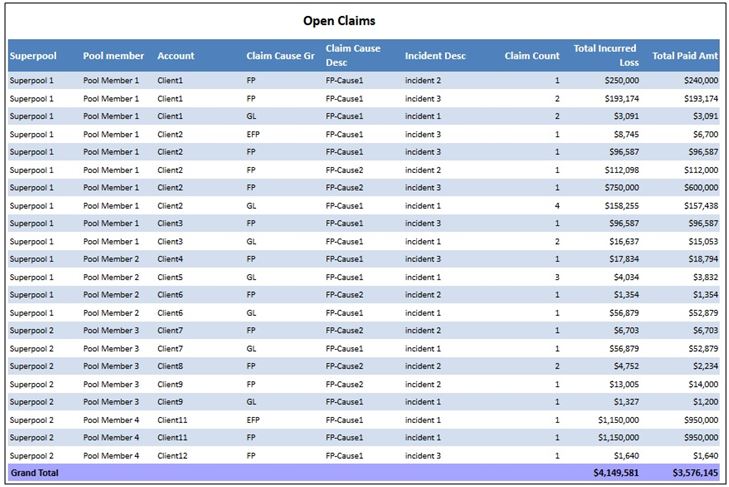
Open Claims Report
Average Claims by Severity
Description
The Report displays business KPIs like Incurred Loss, Paid Amt, Claim Frequency and Avg Incurred Loss summarized by Adjusting Office.

average claims severity by adjuster
Claims Cause
Description:This report helps identify specific causes of loss.
Make your data with Helical Insight.
Helical Insight is the best business intelligence tool for the Property and Casualty Insurance Domain.

Claims Cause Report
Claims Registered
Description: The report provides detailed information of all the claims which are registered. An end user will have the option to filter the data according to dates (month and year), company, line of business, dealer group etc. Based on those input parameters which are selected, the report gets populated up
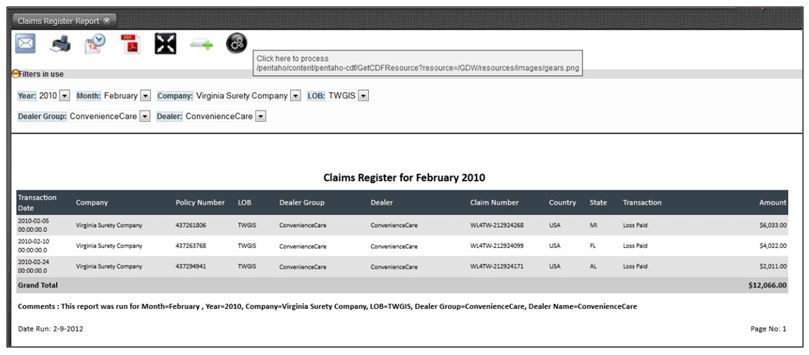
Claims Registered Report
Claims Schedule – By Company
Description: The report provides detailed information regarding the Payments, Loss Adjusting Expense, Outstanding Loss Reserves, Incurred Loss and Salvage Amount by claims.

Claims Schedule
Claims Recovery Summary
Description: The report displays summary of recovery amount by Country, Company, Agent, Line of Business, Claims, Coverage and Date of Loss.

claims recovery summary
General Premium Summary Report
Description: The report displays summary of premium amounts by Country, Company, LOB, Dealer group and Coverage.

general premium summary report
Inforce & Unearned Premium Summary Report
Description: The report displays summary of new/renewal Inforce amount and new/renewal Unearned amounts premiums by Dealer Group and coverage

Premium summary report
Loss Paid and Reserve by LOB
Description: The report displays summary of Loss Paid (MTD), Loss Paid (YTD), Loss Reserve, Expense Paid (MTD), Expense Paid (YTD) and Incurred Amount by LOB.

loss paid report
Policy Transaction Report
Description: The report gives details of policy transactions in given period.
Make your data with Helical Insight.
Helical Insight is the best business intelligence tool for the Property and Casualty Insurance Domain.

policy transaction report
Premium Bordereaux

premium bordereaux
Written & Earned Premium Comparison
Description: The report display comparison between Policy count, Written and Earned Premium for current period and previous period.

premium comparison report
YTD Loss Listing
Description: The report displays YTD summary of Loss Payments, Recoveries and Incurred Loss by Company, Coverage, Dealer Group, Dealer, Claim Number and Date of Loss.

YTD loss listing
Premium production by agent
Description: The report allows user to view Written Premium, Average written Premium, and Policy Count for New and Renewal premiums by Agent

premium production by agent
Profitability – Top 10 Agents
For the selected duration this report will show the amount earner from different companies.
Make your data with Helical Insight.
Helical Insight is the best business intelligence tool for the Property and Casualty Insurance Domain.

Profitability top 10 agents
Policy Register
Description: Description: The report provides detailed information of all policies registered for s

executive dashboard
elected period.

policy register
Executive Dashboard
There could be various dashboards. For example the below dashboard shows information like loss ratio, incurred losses amount and change percentage, written and earned premium, money earner in new versus the renewals etc.
executive dashboard
Underwriting Dashboard
The below dashboard, for the selected product, shows things like written versus earner premium, revenue growth over a period of time from new business / renewal / retention. It is also showing the loss ratio.

underwriting dashboard
What – If Analysis
Make your data with Helical Insight.
Helical Insight is the best business intelligence tool for the Property and Casualty Insurance Domain.
A what if analysis to in which there will be input parameter to select the product. Once the product is selected, end user can select different parameters like policy premium, policies per month, renewal retention, claim severity etc and accordingly he can see what how it will affect the loss ration, earner premium, written premium etc.
For having a demo of the same please get in touch at nikhilesh@helicaltech.com
Nikhilesh Tiwari

Best Open Source Business Intelligence Software Helical Insight is Here