Beginner’s Guide to Crosstab in Business Intelligence Using Jaspersoft IReport
What is Cross Tab?
A Table is just of 2 Dimension but at times we do need our table to be represented in a 3 dimensional manner or in a Dynamic Manner.
Why?
Take for example a table with 2 data set i.e. in the row we have countries and in the column we have months of the year
Now at times our data set will have an extra data which needs to be represented in the table where then can we keep these column or even row?
So here Cross tab Helps in those situation to make the report more meaningful
Now we can have Rows as “Country” and a sub row “State” grouped by the country.
To get a better understanding I’ll be taking an Example to represent my data in-form of a cross-tab.
From the following
Tables :
- sales_fact_1997 sf7
- customer
- time_by_day
Fields like country, state, month, store_sales and etc if required,
should be represented in Cross Tab.
Open Jasper-soft I Report
-> Click on File->New->Report->Select Any Template of your choice
->Remove the Bands you don’t require
in My case i just need the Title and Summary Band so i wont remove them
Connect to the required Tool/Database where your Query will be retrieved from
After connection
Enter your query by clicking on ->

and then

After entering your query select Read Fields and Click OK.
->Go to the palette section and Drag and Drop the cross tab to which ever band you want
(In my case “Summary” Band)
Now select Main Report Data-set and Click Next
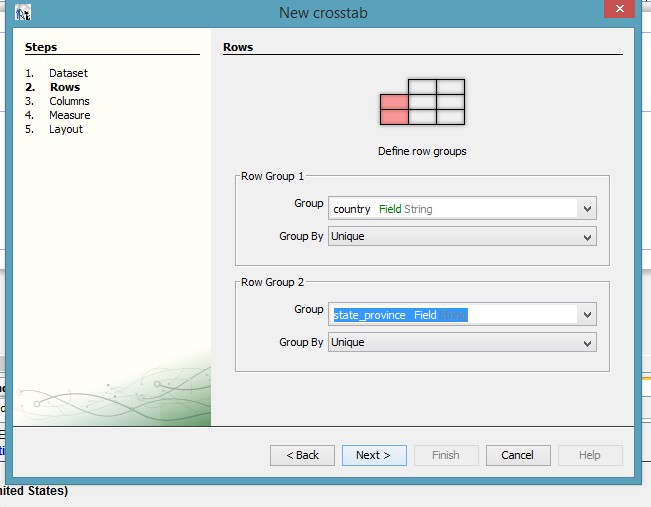
Now In Your Row Group 1 select what do you want as the Group i.e. the 1st Dimension (in My Case Country)
Now in Row Group 2 select what do you want as the Group i.e. the 3rd Dimension which is a Sub-Group of the First Group (in My Case State_province)
As shown below:
Then Click Next
Now in Your Column Group 1 Select what should be your Column Group which is your 2nd Dimension (month of year)
As shown below:

Then click Next
Now in measure what will you like to calculate in your table? So you input in the Measure Field (in my case Store Sales)
And what function will you like to perform (in my case SUM of store sales)
As shown below

Then click Next.
The Next Dialogue Box is of your Choice
Then click Finish
For any formatting select Cross-tab

As shown above
And then perform your formatting techniques.
final output-> 
By Sohail Izebhijie

Best Open Source Business Intelligence Software Helical Insight is Here