Adding new chart in Helical Insight
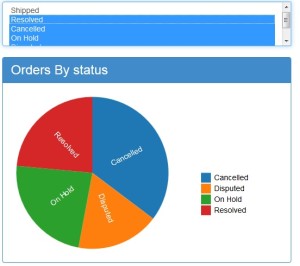
1) Adding the Pie Chart in Helical Insight:-
Please note this blog will help you in adding chart at EFW level and not at frontend Adhoc interface level. helical insight uses D3 (Data-Driven Documents) and C3 library. D3 allows you to bind arbitrary data to a Document Object Model (DOM), and then apply data-driven transformations to the document. For example, you can use D3 to generate an HTML table from an array of numbers.
For adding the Pie chart in the Helical Insight following steps should be followed:-
1) EFW file:- EFW contain the Title, author, description, Template name, visibility of the Dashboard.
2) EFWD File: – EFWD file contain the Data Source Connection Properties such as connection id and connection type.It also contain Url of the connection to the database, User name and Password to the Database
The DataSource Details used in our demo is shown as below:-
<DataSources>
        <Connection id="1" type="sql.jdbc">
           <Driver>com.mysql.jdbc.Driver</Driver>
           <Url>jdbc:mysql://192.168.2.9:3306/sampledata</Url>
            <User>devuser</User>
            <Pass>devuser</Pass>
        </Connection>
    </DataSources>
Data Map contains Map id and connection and connection Type. Map id is same as that specified in the EFWVF. Query for the Data Map and the Parameter to be used is specified in the Tags and Parameter in the Tags.
<DataMap id="2" connection="1" type="sql" >
       <Name>Query for pie chart component - Order Status</Name>
		<Query>
			<![CDATA[
					select STATUS, count(ORDERNUMBER) as totalorders
					from ORDERS
					where STATUS in (${order_status})
					group by STATUS;
			]]>
                </Query>

       <Parameters>
          <Parameter name="order_status" type="Collection" default="'Shipped'"/>
       </Parameters>
</DataMap>
3)EFWVF File :-
In EFWVF file we first set the chart id the chart we set the chart properties. For Pie Chart we set the chart Properties between the tags. The properties such as Chart name, Chart type, Chart Data Source. In chart section we specify the chart script.
In Chart Script we set the below variables to customize the Pie chart
Setting Up the Chart
var placeHolder = "#chart_1";
var chartHeader = "Orders By status";
var width = 300,
height = 300;
The query returns 2 columns – ‘STATUS’ and ‘totalorders’.
As in the JasperReport we set Catagary Expression, Value Expression, Tool Tip for the pie chart,same way the Below variables are set accordingly.
var category = "d.data.STATUS";
var values="d.totalorders";
var tooltip = "\"Total orders with status \"+ d.data.STATUS+\" are \"+d.data.totalorders";
var legendValues = "d.STATUS";
You may change the below script directly for further customization
function angle(d)
{
var a = (d.startAngle + d.endAngle) * 90 / Math.PI - 90;
return a > 90 ? a - 180 : a;
}
$(placeHolder).addClass('panel').addClass('panel-primary');
var radius = Math.min(width, height) / 2;
var color = d3.scale.ordinal().range(["#1f77b4", "#ff7f0e", "#2ca02c", "#d62728", "#9467bd", "#8c564b", "#e377c2", "#7f7f7f", "#bcbd22", "#17becf"]);
var arc = d3.svg.arc().outerRadius(radius - 10).innerRadius(0);
var pie = d3.layout.pie().sort(null).value(function(d) { return eval(values); });
var heading = d3.select(placeHolder).append("h3").attr("class", "panel-heading").style("margin", 0 ).style("clear", "none").text(chartHeader);
Creating The SVG Element
var svg = d3.select(placeHolder).append("div").attr("class", "panel-body").append("svg")
.attr("width", width)
.attr("height", height)
.append("g")
.attr("transform", "translate(" + width / 2 + "," + height / 2 + ")");
Drawing The Pie
var g = svg.selectAll(".arc")
.data(pie(data))
.enter().append("g")
.attr("class", "arc");
g.append("path")
.attr("d", arc)
.style("fill", function(d) { return color(eval(category)); });
g.append("text")
.attr("transform", function(d) {
d.outerRadius = radius -10;
d.innerRadius = (radius -10)/2;
return "translate(" + arc.centroid(d) + ")rotate(" + angle(d) + ")"; })
.attr("dy", ".35em")
.style("text-anchor", "middle")
.style("fill", "White")
.text(function(d) { return eval(category); });
Drawing The Lable and Title
g.append("title")
.text(function(d){ return eval(tooltip)});
var legend = d3.select(placeHolder).select('.panel-body').append("svg")
.attr("class", "legend")
.attr("width", 75 * 2)
.attr("height", 75 * 2)
.selectAll("g")
.data(data)
.enter().append("g")
.attr("transform", function(d, i) { return "translate(50," + (i * 20) + ")"; }); legend.append("rect")
.attr("width", 18)
.attr("height", 18)
.style("fill", function(d){return color(eval(legendValues))});
legend.append("text")
.attr("x", 24)
.attr("y", 9)
.attr("dy", ".35em")
.text (function(d) { return eval(legendValues); });
]]>
4) HTML File:-
HTML file name should be the same that specified in the EFW file under the Template Section.
In HTML File On Top we specify links of the external resources such as :-
<script src="getExternalResource.html?path=UI_Testing/dimple.js"></script>
Below it we create the Divisions for proper alignments and the Position where the Pie Chart should be placed.
<div class="row">
    <div class="col-sm-5">
       <div id="supportChartObj4"></div>
    </div>
    <div class="col-sm-5">
       <div id="supportChartObj5"></div>
    </div>
</div>
Below the Division section,we have Script section we specify the parameters and the chart.
Parameter Creation:-
var select =
{
name: "select",
type: "select",
options:{
multiple:true,
value : 'STATUS',
display : 'STATUS'
},
parameters: ["order_status"],
htmlElementId: "#supportChartObj1",
executeAtStart: true,
map:1,
iframe:true
};
Chart Creation:-
var chart = {
name: "chart",
type:"chart",
listeners:["order_status"],
requestParameters :{
order_status :"order_status"
},
vf : {
id: "1",
file: "Test.efwvf"
},
htmlElementId : "#supportChartObj4",
executeAtStart: true
};
And all the parameters and chart specified in HTML file are passed to the dashboard.init.
This Way Pie chart is Created.

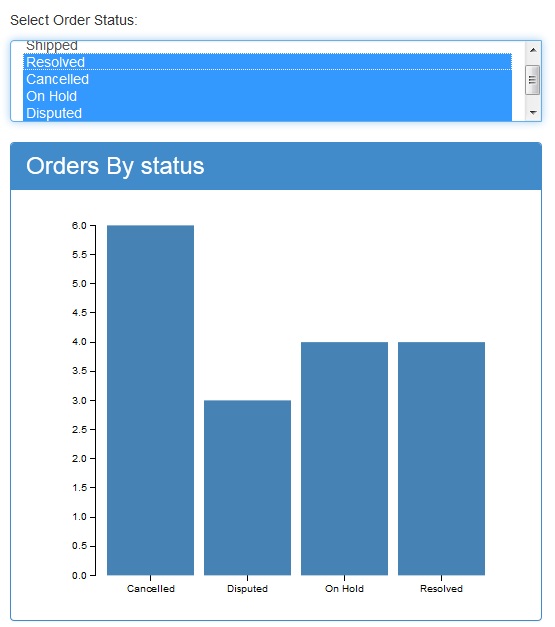
2)Adding the Pie Chart in Helical Insight:-
1)EFW file:- EFW contain the Title, author, description, Template name, visibility of the Dashboard.
2)EFWD File: – EFWD file contain the Data Source Connection Properties such as connection id and connection type.It also contain Url of the connection to the database, User name and Password to the Database
The DataSource Details used in our demo is shown as below:-
<DataSources>
        <Connection id="1" type="sql.jdbc">
           <Driver>com.mysql.jdbc.Driver</Driver>
           <Url>jdbc:mysql://192.168.2.9:3306/sampledata</Url>
            <User>devuser</User>
            <Pass>devuser</Pass>
        </Connection>
    </DataSources>
Data Map contains Map id and connection and connection Type. Map id is same as that specified in the EFWVF. Query for the Data Map and the Parameter to be used is specified in the Tags and Parameter in the Tags.
Ex:-
<DataMap id="2" connection="1" type="sql" >
       <Name>Query for pie chart component - Order Status</Name>
		<Query>
			<![CDATA[
					select STATUS, count(ORDERNUMBER) as totalorders
					from ORDERS
					where STATUS in (${order_status})
					group by STATUS;
			]]>
                </Query>

       <Parameters>
          <Parameter name="order_status" type="Collection" default="'Shipped'"/>
       </Parameters>
</DataMap>
3)EFWVF File :-
In EFWVF file we first set the chart id the chart we set the chart properties. For Pie Chart we set the chart Properties between the tags. The properties such as Chart name, Chart type, Chart Data Source. In chart section we specify the chart script.
In Chart Script we set the below variables to customize the Pie chart
Setting Up the Chart
var placeHolder = "#chart_1";
var chartHeader = "Orders By status";
var margin = {top: 20, right: 30, bottom: 30, left: 70},
width = 500 - margin.left - margin.right,
height = 400 - margin.top - margin.bottom;
The query returns 2 columns – ‘STATUS’ and ‘totalorders’.
As in the JasperReport we set Catagary Expression, Value Expression, Tool Tip for the pie chart,same way the Below variables are set accordingly.
var category = "d.STATUS";
var values="d.totalorders";
var tooltip = "\"Total orders with Status \"+ d.STATUS+\" are\"+d.totalorders";
You may change the below script directly for further customization
$(placeHolder).addClass('panel').addClass('panel-primary');
var x = d3.scale.ordinal().rangeRoundBands([0, width], .1);
var y = d3.scale.linear().range([height, 0]);
var xAxis = d3.svg.axis().scale(x).orient("bottom");
var yAxis = d3.svg.axis().scale(y).orient("left");
var heading = d3.select(placeHolder).append("h3").attr("class", "panel
heading").style("margin", 0 ).style("clear", "none").text(chartHeader);
var chart = d3.select(placeHolder).append("div").attr("class", "panel-body")
.append("svg")
.attr("width", width + margin.left + margin.right)
.attr("height", height + margin.top + margin.bottom)
.append("g")
.attr("transform", "translate(" + margin.left + "," + margin.top + ")");
Drawing The Bar Chart
x.domain(data.map(function(d) { return eval(category); }));
y.domain([0, d3.max(data, function(d) { return eval(values); })]);
        chart.append("g")
        .attr("class", "x axis")
	.attr("transform", "translate(0," + height + ")")
	.call(xAxis);

	chart.append("g")
	.attr("class", "y axis")
	.call(yAxis);

	chart.selectAll(".bar")
	.data(data)
	.enter().append("rect")
	.attr("class", "bar")
	.attr("x", function(d) { return x(eval(category)); })
	.attr("y", function(d) { return y(eval(values)); })
	.attr("height", function(d) { return height - y(eval(values)); })
	.attr("width", x.rangeBand());

        chart.selectAll(".bar")
	.append("title")
	.text(function(d){ return eval(tooltip)});
4) HTML File:-
HTML file name should be the same that specified in the EFW file under the Template Section.
In HTML File On Top we specify links of the external resources such as :-
<script src="getExternalResource.html?path=UI_Testing/dimple.js"></script>
Below it we create the Divisions for proper alignments and the Position where the Pie Chart should be placed.
<div class="row">
    <div class="col-sm-5">
       <div id="supportChartObj4"></div>
    </div>
    <div class="col-sm-5">
       <div id="supportChartObj5"></div>
    </div>
</div>
Below the Division section,we have Script section we specify the parameters and the chart.
Parameter Creation:-
var select =
{
name: "select",
type: "select",
options:{
multiple:true,
value : 'STATUS',
display : 'STATUS'
},
parameters: ["order_status"],
htmlElementId: "#supportChartObj1",
executeAtStart: true,
map:1,
iframe:true
};
Chart Creation:-
var chart = {
name: "chart",
type:"chart",
listeners:["order_status"],
requestParameters :{
order_status :"order_status"
},
vf : {
id: "2",
file: "Test.efwvf"
},
htmlElementId : "#supportChartObj4",
executeAtStart: true
};
And all the parameters and chart specified in HTML file are passed to the dashboard.init.
This Way Bar chart is Created.


Best Open Source Business Intelligence Software Helical Insight is Here