This blog will let you know to customize the clusters of markers using Leaflet.js
Prerequisites are Leaflet.js library
Make data easy with Helical Insight.
Helical Insight is the world’s best open source business intelligence tool.
Leaflet.js is an open-source library using which we can deploy simple, interactive, lightweight web maps. The data will have the information about the latitudes and the longitudes and the data of the respective data point. Based on the data we will be having many markers and with zoom level:0 the map looks like this
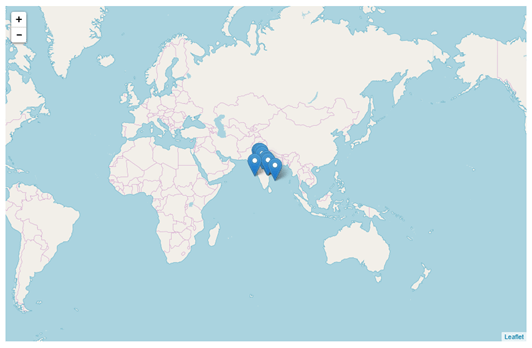
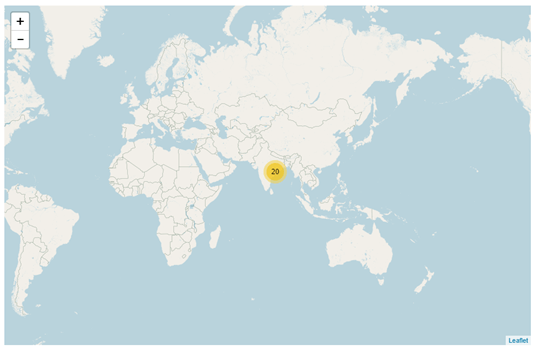
As all the markers are very close to each other and there is no clarity of the information plotted. In this case we can use marker clustering which will group all the markers on the area specified and show the count of all markers on that region by default.
var markers = new L.MarkerClusterGroup();
markers.addLayer(L.marker([175.3107, -37.7784]));
markers.addLayer(L.marker([20.686846, 85.218412]));
markers.addLayer(L.marker([20.686856, 85.218402]));
markers.addLayer(L.marker([15.84610885,79.44522528]));
map.addLayer(markers);
L.marker([latitude, longitude]) is used to plot a marker of the respective latitude and longitude.
MarkerClusterGroup() is a function which is responsible for the clustering of the markers.
addLayer() is used to add those to layers.
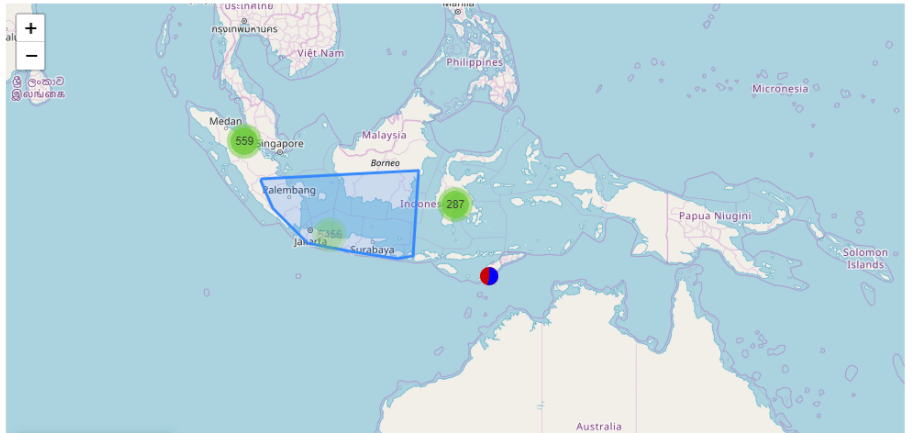
It is having more functionality like it displays the bounds of the cluster on mouse hover on the cluster with ‘showCoverageOnHover’ and on clicking on a cluster we can zoom to its bounds with ‘zoomToBoundsOnClick’.
We can customize the maker cluster in many ways and some of them are:
- We have the control of the value to be shown on the marker cluster.
- Change the color of the marker cluster based on the value.
- Create our own cluster icon.
Make data easy with Helical Insight.
Helical Insight is the world’s best open source business intelligence tool.
var markerCluster = new L.MarkerClusterGroup({
iconCreateFunction: function (cluster) {
	var markers = cluster.getAllChildMarkers();
	var customValue= '' + CustomValue + '';
	return L.divIcon({ html: customValue, className: 'mycluster', iconSize: L.point(32, 32) });
},
});

.customIcon {
    width: 32px;
    height: 32px;
    line-height: 32px;
    background-image: url('custom.png');
    text-align: center;
}
The above code explains how to display custom value on the cluster using ‘customValue’ and provide css.L.divIcon({}) is responsible for displaying the custom icon.
Make data easy with Helical Insight.
Helical Insight is the world’s best open source business intelligence tool.

Best Open Source Business Intelligence Software Helical Insight is Here
A Business Intelligence Framework
For further queries please get back to us at support@helicaltech.com
Thank You
Neel Gagan Manda
BI Developer
Helical IT Solutions Pvt Ltd