Measuring Ad-hoc performance
1. Log on JasperReports server as system admin (superuser by default).
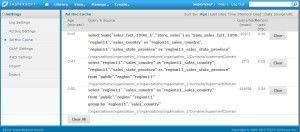
2. Navigate to Manage > Server Setting > Ad hoc cache.
The Ad Hoc Cache page appears, displaying all the datasets that are in the cache, sorted by age.
3. Ad Hoc performance can be quickly measured by checking values of Query/Fetch
- Query (msec): Time from when query was sent to the db until the first row was received. If this is slow then we should apply proper indexes in DB.
- Fetch (msec): Time from when first row was received until the last row was received. If this is slow there might be a network bottleneck.
Performance tuning in Ad Hoc
Setting query limit
- Log on JasperReports server as system admin (superuser by default).
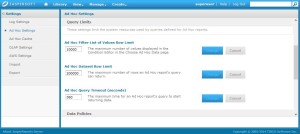
- Navigate to Manage > Server settings > Ad Hoc Settings.
- There are two parameters there that are worth testing for possible performance gains:
a) Ad Hoc Filter List of Values Row Limit
- The maximum number of items that should be displayed in the Condition Editor when a user defines filters for an Ad Hoc report that is based on a Domain. If this limit is exceeded when users define filters, Jasperserver displays a message to that effect.
- Setting this to a lower value can improve performance.
b) Ad Hoc Dataset Row Limit
- The maximum number of rows that an Ad Hoc report can return. JasperServer truncates the data when the limit is reached.
- Setting this to a lower number may improve performance, but your reports may not reflect the full data set.
(Hope this blog would help you find quicker ways to resolve Ad-hoc performance related issues.)
Best Regards,
Archana

Best Open Source Business Intelligence Software Helical Insight is Here

A Business Intelligence Framework
Subscribe
Login
0 Comments

