Dynamic Query implementation in stacked bar chart using high chart library in jasper CVC
In this blog, I’ll discuss how dynamically data returned from query can be used in stacked bar chart. Here, I have created stacked bar chart using highcharts library through jasper CVC component in jasper studio. I am writing this blog, considering that whosoever is trying this has previous knowledge about jasper CVC component integration using highchart library.
Initially create one blank jasper report using CVC component in jasper studio. Create two .js files: build.js, stackedbarchart.js. Use the following codes in their respective files:
Code in Build.js:

({

baseUrl: '',

paths: {

'highcharts': 'highcharts'

},

name: "stackedbarchart",

out: "stackedbarchart.min.js"

})
Sample query used for report:
select ‘Silent Alert’ as alert_type ,’1′ as number, ‘John’ as MonthYear , 100 as count
union
select ‘Silent Alert’ as alert_type ,’1′ as number, ‘Jane’ as MonthYear , 150 as count
union
select ‘Silent Alert’ as alert_type ,’1′ as number, ‘Joe’ as MonthYear , 50 as count
union
select ‘No Motion Alert’ as alert_type ,’2′ as number, ‘John’ as MonthYear , 200 as count
union
select ‘No Motion Alert’ as alert_type ,’2′ as number, ‘Jane’ as MonthYear , 250 as count
union
select ‘No Motion Alert’ as alert_type ,’2′ as number, ‘Joe’ as MonthYear , 300 as count
union
select ‘Missed Check-in Alert’ as alert_type , ‘3’ as number,’John’ as MonthYear , 150 as count
union
select ‘Missed Check-in Alert’ as alert_type , ‘3’ as number,’Jane’ as MonthYear , 180 as count
union
select ‘Missed Check-in Alert’ as alert_type , ‘3’ as number,’Joe’ as MonthYear , 120 as count
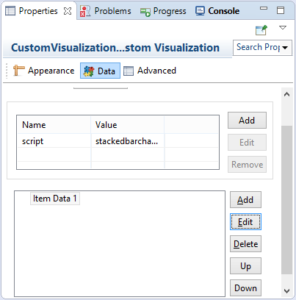
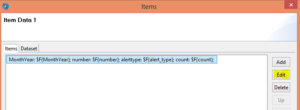
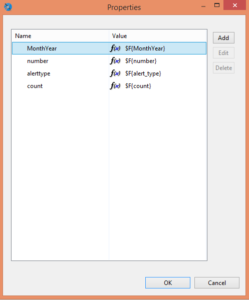
Set the fields name in the properties of CVC component for the query as shown in the images below:
Code in stackedbarchart.js:

//function to compare series name value with data coming from query.

function passobjalert(objs, key) {

var aa = objs.filter(function(v) {

return v.alerttype === key;

}).map(function(val) {

return val.count;

});

return aa;

};

var silentalert = passobjalert(WholeObj, "Silent Alert");

var motionalert = passobjalert(WholeObj, "No Motion Alert");

var missedcheck = passobjalert(WholeObj, "Missed Check-in Alert");

silentalertObj.name = WholeObj[0].alerttype;

silentalertObj.data = silentalert;

motionalertObj.name = WholeObj[3].alerttype;

motionalertObj.data = motionalert;

missedcheckObj.name = WholeObj[6].alerttype;

missedcheckObj.data = missedcheck;

console.log("obj: ", silentalertObj);

console.log("obj: ", motionalertObj);

console.log("obj: ", missedcheckObj);


Highcharts.chart(instanceData.id, {

chart: {

renderTo: instanceData.id,

type: 'bar'

},

xAxis: {categories: MonthUnique

},

yAxis: {

min: 0,

title: {

text: 'Count'

},

stackLabels: {

enabled: true,

style: {

fontWeight: 'bold',

color: (Highcharts.theme && Highcharts.theme.textColor) || 'gray'

}

}

},

title: {

text: ''

},

plotOptions: {

bar: {

stacking: 'normal',

dataLabels: {

enabled: true,

color: (Highcharts.theme && Highcharts.theme.dataLabelsColor) || 'white'

}

}

},

series: [silentalertObj,motionalertObj,missedcheckObj]

});

};

return result1;

});
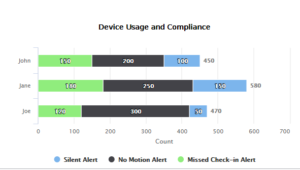
After successful build of the component, run the report in HTML format. The final output will be as shown in the following screenshot:

Best Open Source Business Intelligence Software Helical Insight is Here

A Business Intelligence Framework
Hope it helps!
Thanks,
Nisha Sahu
BI Developer
Business Intelligence iReprot Jasper CVC Jasper iReport Jasperserver jaspersoft


