Parameters are named variables that can transfer a value for use by an action or an object. By using parameters, you can create an easier way for a dashboard user to interact with dashboard features in a less technical way.
Make data easy with Helical Insight.
Helical Insight is world’s best open source business intelligence tool.
To make the parameters accessible to the dashboard viewer, you add a parameter control. You can set up cascading controls, so that a selection in one control filters the options that display in another control. A control can appear as a list of options, a slider, or a text entry area. If you don’t create a control, you can still pass a value to your parameter in the dashboard URL.
For a parameter to work, it needs to be connected to something in your analysis, regardless of whether it has a related control. You can reference parameters in the following:
• Calculated fields (except for multi-value parameters)
• Filters
• Dashboard and analysis URLs
• Actions
To create or edit a basic parameter
1. Choose an analysis to work with, then decide which field you want to parameterize.
2. Choose the Parameters pane from the left side of the screen.
3. Add a new parameter by choosing the plus sign (+) near the top of the pane.
Edit an existing parameter by first choosing the v-shaped icon near the parameter name and then choosing Edit parameter.
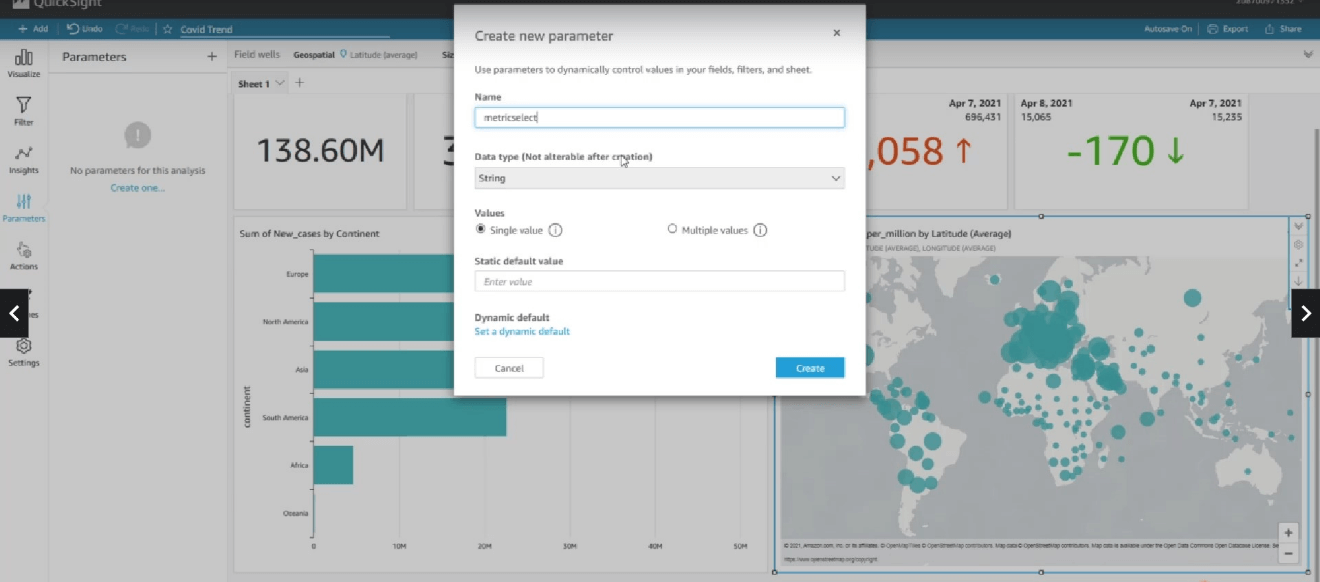
4. For Name, enter an alphanumeric value for the parameter.
5. For Data type, choose String, Number, Integer, or Datetime.
If you choose String, Number, or Integer, do the following:
a. For Values, choose Single value or Multiple values.
b. (Optional) For Static default value or Static multiple default values, enter one or more values.
c. (Optional) Choose Show as blank by default.
Select this option to show the default value for multi-value lists as blank. This option only applies to multi-value parameters.
• If you choose Datetime, do the following:
a. For Time granularity, choose Day, Hour, Minute, or Second.
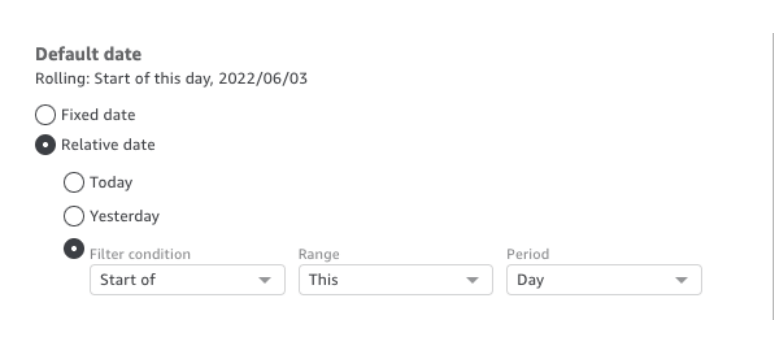
b. For Default date, select either Fixed date or Relative date, and then do the following:
o If you select Fixed date, enter a date and time by using the date and time picker.
o If you select Relative date, choose a rolling date. You can choose Today, Yesterday, or you can specify the Filter condition (start of or end of), Range (this, previous, or next), and Period (year, quarter, month, week, or day).
6. (Optional) Choose Set a dynamic default to create a default that is user-specific.
After creating parameters, we see connect your parameter with different options like below.

Make data easy with Helical Insight.
Helical Insight is world’s best open source business intelligence tool.
Here, we are going to select “Control”. Click on control option, we will see add control options.
1. We will see name of the parameter.
2. Enter a display name. This name appears at the top of the workspace, and later at the top of the sheet that a dashboard displays on.
3. Choose a style for the control from the following:
• Text field
• Text field – multiline
• Dropdown
• Dropdown multiselect
• List
• List – multiselect
• Slider
• Date-picker
4. (Optional) If you choose a dropdown control, the screen expands so you can choose the values to display. You can either specify a list of values, or use a field in a dataset. Choose one of the following:
• Specific values: To create a list of specific values, type in one per line, with no
separating spaces or commas, as shown in the following screenshot.
In the control, the values display alphabetically, not in the order that you typed them.
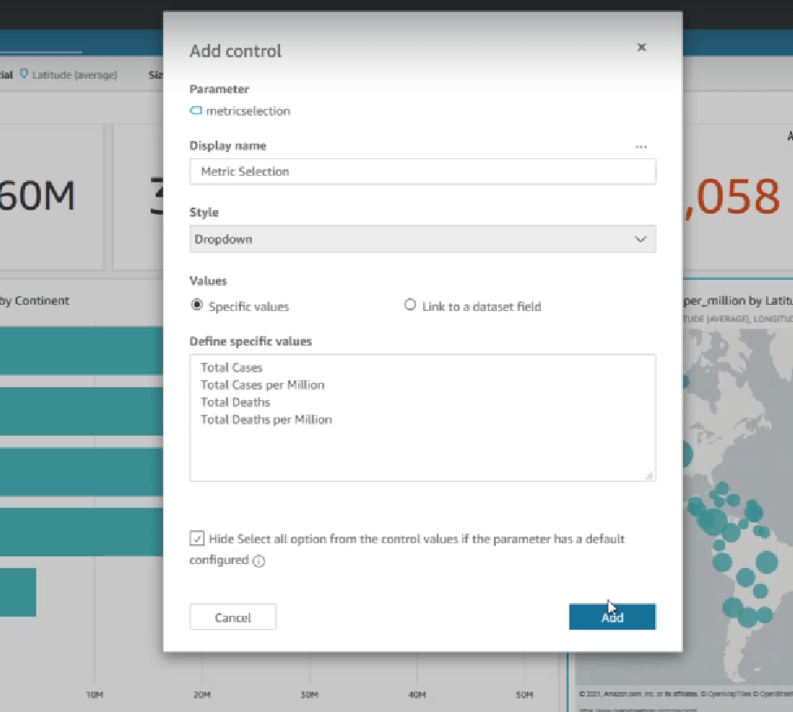
When you finish choosing options for your control, choose Add.
The finished control appears at the top of the workspace. The context menu, shaped like a v, offers four options.

In the workspace, you can also resize and rearrange your controls. The dashboard users see them as you do, except without being able to edit or delete them.
Using calculated fields with parameters:
You can pass the value of a parameter to a calculated field in an analysis. When you create a calculation, you can choose existing parameters from the list of parameters under Parameter list. You can’t create a calculated field that contains a multivalued parameter—those with a multiselect drop-down control.
To create calculated field:
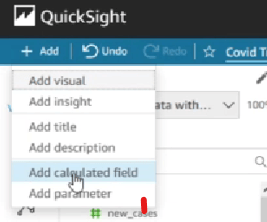
1. Click on Visualize in side bar, then click on ‘+ Add’.
2. Select Add calculated field.
Make data easy with Helical Insight.
Helical Insight is world’s best open source business intelligence tool.
For the formula, you can use any of the available functions. You can pass the viewer’s selection(values)s from the parameter control, to the ifElse function. In return, you get a metric. The following shows an example.
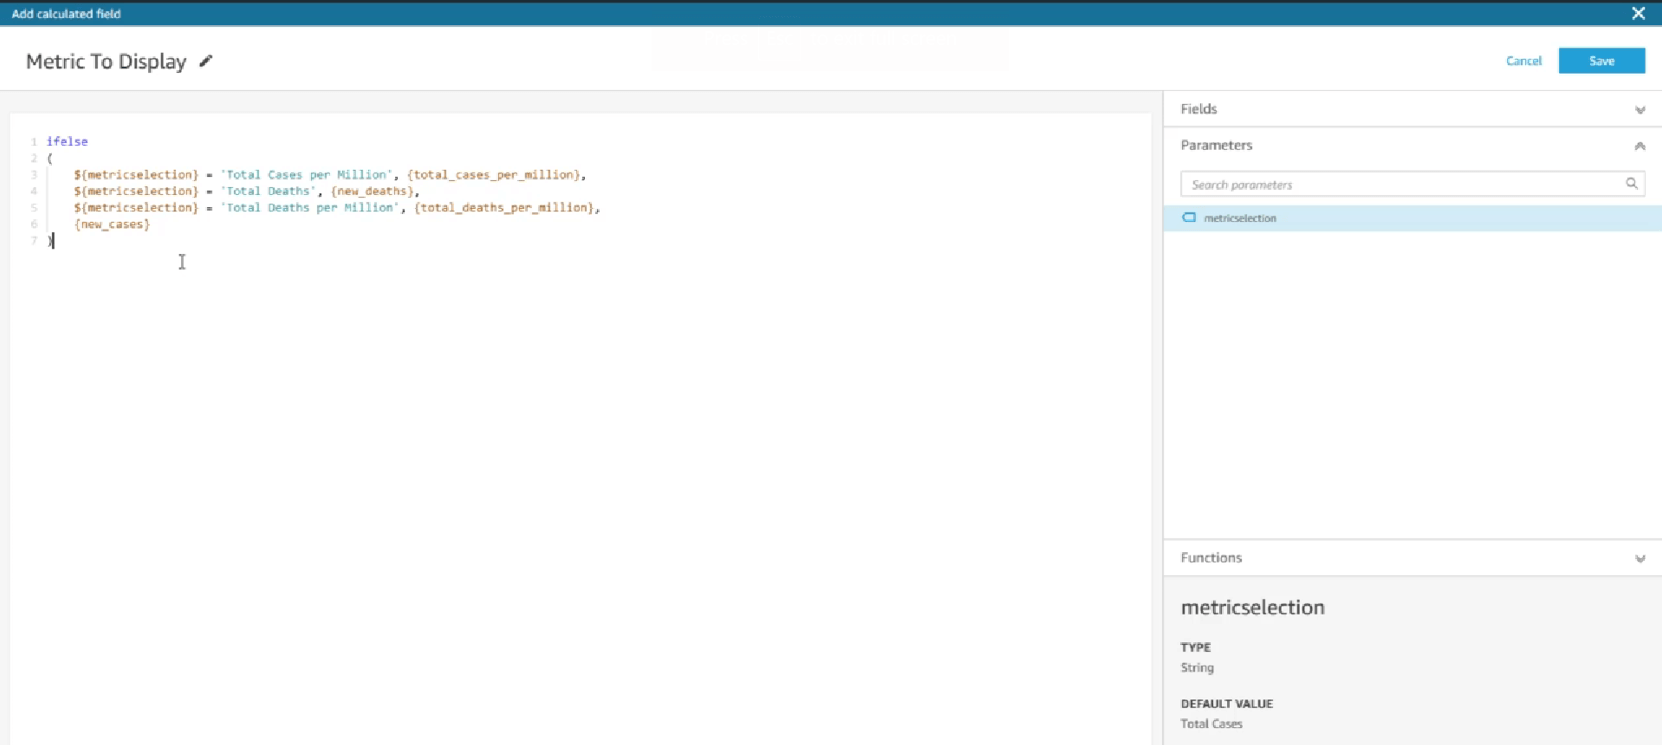
The preceding example creates a metric that you can use in a field well. Then, when a user chooses a value from the parameter control, the visual updates to reflect their selection.
Thank You
Prashant Kanna
Helical IT Solutions

Best Open Source Business Intelligence Software Helical Insight is Here
