Introduction: Is Your BI Platform Ready for the Next Stage of Analytics?
Business intelligence has evolved beyond creating charts and dashboards. Organizations now expect their analytics platforms to help employees discover insights, investigate business performance, distribute reports, and integrate data experiences directly into business applications.
Tableau is a well-known platform for visual analytics and interactive dashboards. However, as business intelligence expands across departments, customer-facing applications, and operational workflows, organizations may need to reassess whether their existing platform meets their long-term technical and financial requirements.
For example, a company might want to provide dashboards to hundreds of customers, allow non-technical employees to explore business data, generate AI-assisted insights, and deliver consistently formatted financial reports. Managing these requirements through separate products can increase integration work and administrative complexity.
This is where Helical Insight, a free, open-source business intelligence and analytics platform, becomes an option worth evaluating.
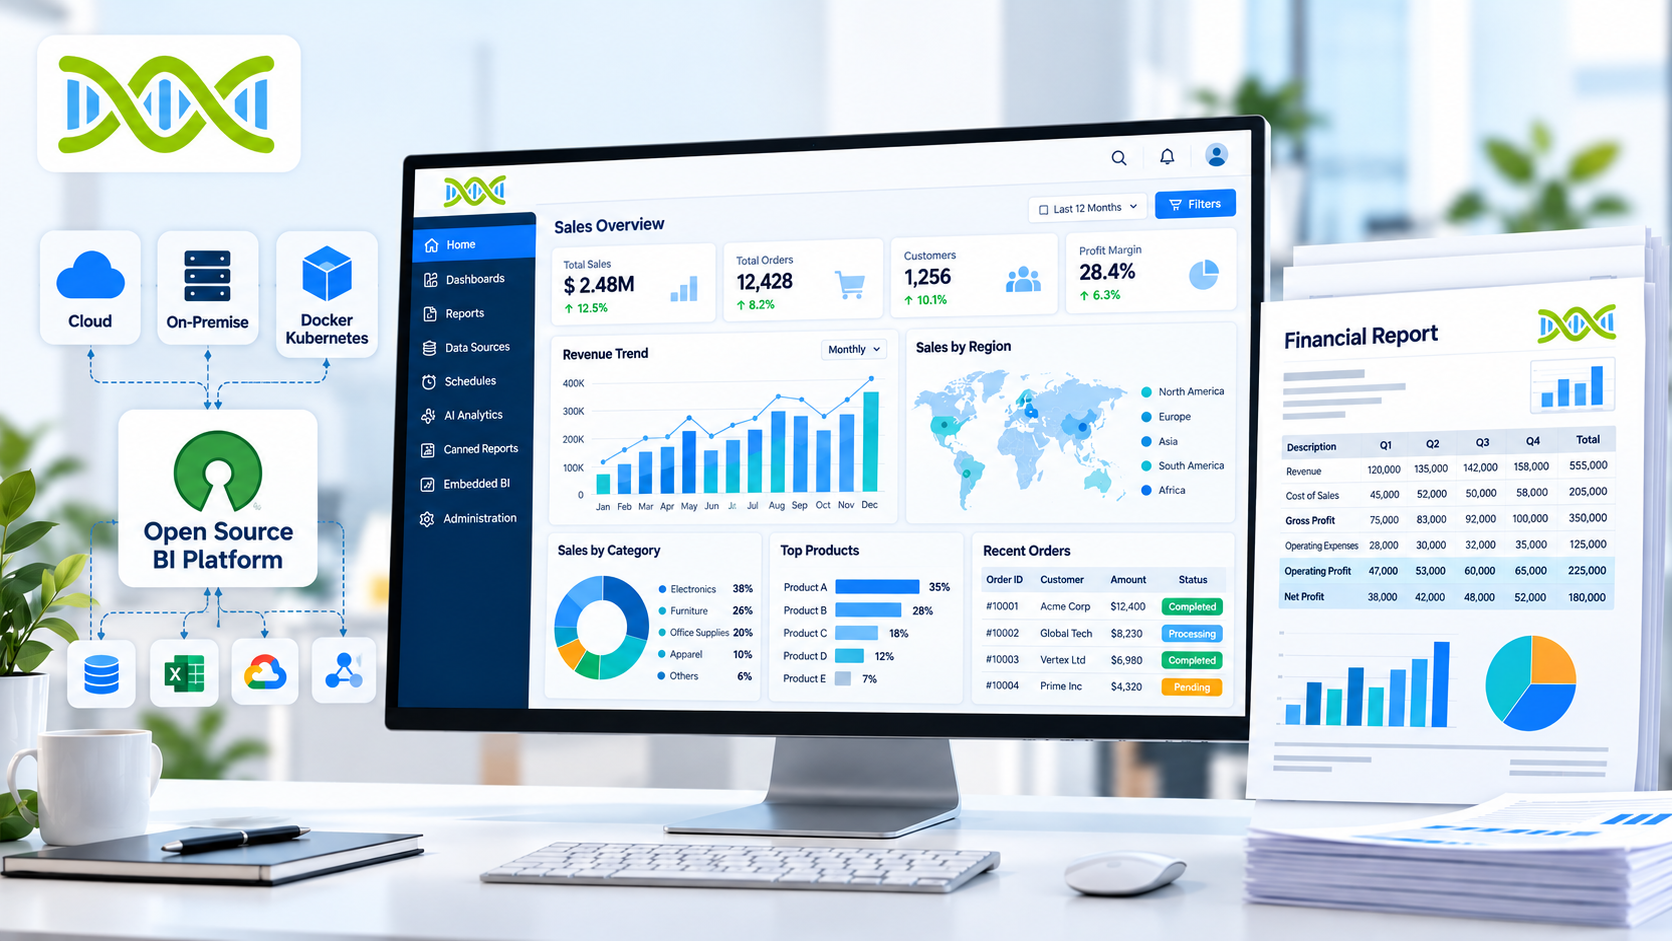
Developed by Helical IT Solutions, Helical Insight brings together interactive dashboards, self-service analytics, AI-powered conversational BI, embedded analytics, and pixel-perfect canned reporting. Its extensible architecture and supported deployment options also make it relevant to organizations that want greater control over how analytics is implemented.
Rather than evaluating a Tableau replacement solely by the number of charts it offers, this article examines how Helical Insight can fit into a broader business intelligence strategy.
1. What Should Businesses Look for in a Tableau Alternative?
Choosing a BI platform is not simply a software replacement decision. It affects how employees access information, how applications deliver analytics, and how organizations manage reporting over time.
Several requirements deserve attention before selecting an alternative.
Predictable costs as analytics adoption grows
Analytics often begins with a small group of analysts. As more teams adopt dashboards and reports, organizations may need to expand access to managers, operational staff, external partners, and customers.
The cost of scaling depends on the licensing model, deployment architecture, required features, and number of users or applications involved.
A free, open-source BI platform can be attractive when an organization wants to evaluate alternatives to user-based licensing costs. However, infrastructure, implementation, administration, and support can still contribute to the total cost of ownership.
Analytics for technical and non-technical users
Data analysts may be comfortable writing SQL queries and designing complex visualizations. Business users, on the other hand, often want straightforward ways to filter data, explore trends, and answer everyday questions.
A suitable Tableau alternative should provide appropriate analytical workflows for both audiences.
Self-service reporting, interactive filters, drill-down functionality, and conversational analytics can help reduce dependence on technical teams for routine analysis.
Support for different reporting requirements
Not every business question is best answered with a dashboard.
Sales managers may need interactive visualizations, while finance teams require multi-page statements, and customers may need downloadable invoices or operational reports.
Organizations should determine whether their BI platform can support these different outputs within one environment or whether separate reporting products will be necessary.
Control over deployment and integrations
Some organizations prefer managed cloud services. Others need to deploy analytics on their own infrastructure or within a specific cloud environment.
Data governance, application architecture, internal security policies, and regulatory requirements can influence this decision.
A flexible BI platform should be assessed for its supported deployment models, integration options, authentication capabilities, and controls over data access.
2. Introducing Helical Insight: An Open-Source BI Platform Beyond Visualization
Helical Insight is a business intelligence platform designed to support data analysis, reporting, dashboard creation, and embedded analytics.
Its value proposition extends beyond dashboard design by combining several analytical capabilities within a common platform.
Key capabilities include:
- Interactive dashboards: Present business performance through charts, tables, KPIs, and filters.
- Self-service BI: Enable users to create and explore reports through visual interfaces.
- AI-powered analytics: Use Instant BI for conversational analysis of connected business data.
- Embedded analytics: Integrate reports and dashboards into existing applications.
- Pixel-perfect reporting: Create structured, multi-page documents through the Canned Reporting module.
- Report distribution: Support configured exporting, scheduling, and report delivery workflows.
- Security and access management: Apply supported user permissions and data-access controls.
- Integration and customization: Extend analytics through APIs and the platform's configurable architecture.
- Deployment flexibility: Evaluate supported self-hosted environments, including on-premises infrastructure.
According to the product information provided by Helical Insight, its Community Edition makes the full feature set available for free, with commercial support and branding being principal distinctions from the Enterprise Edition. Review the current edition terms and licensing documentation before making a production deployment decision.
For organizations searching for a free Tableau alternative, the important question is how these capabilities align with their existing analytical workflows and future requirements.
3. Comparing Helical Insight and Tableau by Business Requirements
A meaningful comparison should focus on the work users need to accomplish rather than assuming that two BI products operate identically.
| Evaluation area | Tableau | Helical Insight |
|---|---|---|
| Interactive dashboards | Core platform capability | Interactive dashboards and visualizations |
| Visual data exploration | Advanced visual analytics | Interactive charts, filtering, and analytical navigation |
| Self-service analytics | Visual analytics and data exploration | Visual report creation and dashboard exploration |
| AI-assisted analysis | Capabilities vary by Tableau product and configuration | Instant BI with supported LLM integrations |
| Embedded BI | Embedded analytics offerings | Embedded analytics and integration capabilities |
| Pixel-perfect documents | Evaluate specific reporting requirements and available components | Dedicated Canned Reporting module |
| Open-source availability | Proprietary commercial platform | Free, open-source Community Edition |
| Deployment approach | Cloud and other supported deployment options, depending on product | Supported self-hosted and other deployment options |
| Custom integration | Available through supported APIs and integration mechanisms | APIs and extensible integration architecture |
| Migration | Existing Tableau environment | Migration utilities offered by the Helical Insight team |
This is a high-level comparison, not a claim that every feature is equivalent. Capabilities, licensing, and implementation requirements should be validated against the exact product editions and versions being considered.
For example, a company that primarily needs advanced visual exploration should test representative dashboards and calculations. An organization that distributes customer statements should separately evaluate document formatting, pagination, exports, and scheduling.
The right alternative is the platform that satisfies the organization's actual requirements with an acceptable level of implementation effort.
4. Interactive Dashboards That Support Business Investigation
Dashboards are most valuable when they help users move from identifying a problem to understanding its underlying cause.
Helical Insight supports dashboard experiences that combine visualizations, tables, filters, and other report elements.
Consider a retail company monitoring performance across multiple locations. A dashboard might display total revenue, monthly sales trends, product-category performance, and regional comparisons.
When revenue declines, the business user needs more than a number on the screen. They need to investigate which locations, products, or time periods contributed to the change.
Explore information through interactive analysis
Depending on the report and dashboard configuration, Helical Insight supports analytical interactions such as:
- Drill-down into hierarchical data.
- Drill-through to more detailed reports.
- Filtering and exclusion of selected values.
- Visualization customization using options such as labels, colors, sizes, and tooltips.
- Interactions between dashboard panels.
- Date-based filtering and relative time periods.
These capabilities support common workflows in sales analysis, operational reporting, inventory monitoring, and financial performance reviews.
Example: Investigating declining sales
Imagine a sales manager notices a decline in monthly revenue.
The investigation could follow this sequence:
- Review the revenue KPI and compare it with the previous period.
- Filter the dashboard by region.
- Drill down into the underperforming region's cities.
- Examine product categories and individual products.
- Open a detailed report to investigate the relevant transactions.
This approach gives business users a structured way to investigate performance without manually recreating every view.
For organizations considering a Tableau alternative, testing these interactions with real business data is more useful than comparing dashboard screenshots alone.
5. AI-Powered Business Intelligence With Instant BI
Traditional BI workflows often require users to understand report structures, select appropriate dimensions, configure filters, or request assistance from analysts.
Conversational analytics introduces another way to explore data: users express a business question in natural language and receive an analytical response.
Helical Insight provides an AI-powered module called Instant BI for conversational analysis of connected business data.
For example, a user might ask:
- Which products generated the highest revenue last quarter?
- How did regional sales change compared with the previous month?
- Which customer segments experienced declining sales?
- What were the top-performing product categories this year?
Depending on the configured data model, permissions, and supported integrations, these questions can help users explore business information through analytical results such as tables and charts.
Why conversational analytics matters
Conversational BI can make analytics more approachable for employees who do not routinely write SQL queries or build dashboards.
It can also provide an additional way to investigate data when an existing report does not answer a particular question.
However, natural-language analytics should not be treated as automatically correct. Results depend on data quality, model configuration, semantic understanding, and the user's access permissions. Organizations should validate important calculations and business-critical conclusions.
Bring Your Own LLM: Align AI with your technology strategy
An important consideration when selecting an AI-enabled BI platform is whether the organization can choose its preferred language-model provider.
Helical Insight supports a Bring Your Own LLM approach using supported model integrations.
This gives organizations an opportunity to evaluate AI options according to their existing technology stack, deployment preferences, cost considerations, and governance requirements.
For example, a business might compare hosted models with supported self-hosted model configurations before choosing an approach for production use.
The precise integration, data flow, security controls, and model compatibility depend on the selected configuration. Sensitive business data should only be connected after the organization has reviewed the relevant documentation and security requirements.
For companies exploring an open-source Tableau alternative with AI-powered analytics, this flexibility is worth testing alongside dashboard functionality.
6. Pixel-Perfect Reporting: When Dashboards Are Not Enough
One requirement that deserves particular attention in BI evaluations is structured document reporting.
Interactive dashboards are designed for exploration. Formal business documents often require fixed layouts, controlled pagination, repeating headers, consistent totals, and carefully positioned content.
Common examples include:
- Invoices and purchase orders.
- Bank and account statements.
- Salary slips.
- Profit-and-loss statements.
- Financial and compliance reports.
- Detailed operational reports.
- Customer-facing business documents.
These requirements are commonly associated with canned reporting or pixel-perfect paginated reporting.
How Helical Insight approaches document reporting
Helical Insight includes a dedicated Canned Reporting module for designing formatted, multi-page reports.
The browser-based report designer supports document layouts containing elements such as tables, headers, footers, calculations, and images.
This makes the module relevant to organizations that need repeatable business documents alongside interactive dashboards.
Consider a financial services company that uses dashboards to monitor account performance but also needs standardized statements for customers. The dashboard and statement serve different purposes: one supports analysis, while the other delivers a consistent document.
Having both reporting approaches within the same BI platform can help reduce the need to maintain separate reporting environments, depending on the organization's requirements.
For a detailed assessment, test representative documents for page breaks, formatting, export fidelity, calculations, and scheduled delivery.
7. Embedded Analytics for SaaS Products and Customer Portals
Many software companies want to provide analytics directly within their own products.
A CRM application might display customer performance. An inventory management system could show stock trends. A financial application might provide operational summaries without sending users to a separate BI portal.
This is the purpose of embedded analytics.
Helical Insight supports embedded BI capabilities and APIs that organizations can evaluate when integrating analytics into existing applications.
Practical use cases
SaaS product analytics: Add dashboards to a subscription-based software product.
Customer reporting portals: Provide customers with access to relevant reports and business metrics.
Enterprise applications: Incorporate analytics into internal systems used by sales, operations, finance, or management teams.
White-label analytics: Evaluate branding and interface customization options for a product's analytics experience.
Multi-tenant environments: Assess how tenant-specific access, data isolation, and permissions can be implemented for applications serving multiple customers.
For example, a SaaS vendor serving 200 customer organizations may want each customer to access only its own sales and operational data.
The implementation must account for authentication, authorization, tenant isolation, and data-access enforcement. These controls should be tested explicitly rather than assuming that embedding alone guarantees security.
Organizations evaluating Helical Insight for embedded analytics should validate the relevant APIs, authentication integrations, licensing terms, and deployment architecture for their intended use case.
8. Reduce Tableau Migration Rework With a Structured Approach
Replacing a BI platform can be more complicated than recreating charts.
A mature Tableau environment may contain years of workbooks, calculated fields, data connections, dashboard interactions, access rules, and operational processes.
A migration strategy should preserve business logic wherever practical while identifying opportunities to simplify outdated reports.
Helical Insight's team offers automated utilities intended to assist with Tableau-to-Helical Insight migration. Their applicability and the amount of automation depend on the source environment and the components being migrated.
A practical migration framework
Step 1: Inventory existing assets
List workbooks, dashboards, data sources, calculations, filters, user groups, and embedded analytics implementations.
Step 2: Classify business requirements
Separate dashboards used for interactive exploration from operational reports, scheduled documents, and customer-facing analytics.
Step 3: Identify dependencies
Review custom SQL, calculated fields, data relationships, hierarchies, security rules, and external application integrations.
Step 4: Select representative reports
Choose a small group of simple and complex dashboards, including examples that cover the most important business workflows.
Step 5: Test migration utilities
Discuss the available migration tools with the Helical Insight team and determine which components can be migrated automatically and which require manual work.
Step 6: Validate results
Compare totals, calculations, filters, visualizations, permissions, exports, and user interactions against the original environment.
Step 7: Plan deployment and user adoption
Prepare the production environment, access controls, performance testing, documentation, and training before wider rollout.
A pilot project provides a more reliable estimate of migration effort than assuming every Tableau workbook will transfer without modification.
9. Open-Source BI Alternatives: Choosing Beyond Popularity
Organizations researching free BI software will encounter products such as Apache Superset, Metabase, Redash, and other community-driven analytics tools.
Each platform has its own strengths, architecture, user experience, and licensing model. The best option depends on the intended use case.
| BI platform | A useful starting point for evaluation |
|---|---|
| Apache Superset | Data exploration, SQL-oriented workflows, and dashboarding |
| Metabase | Accessible analytics and self-service questions |
| Redash | SQL-based querying and visualization workflows |
| Helical Insight | Dashboards, self-service reporting, conversational analytics, embedded BI, and pixel-perfect reporting |
This table is intended as an initial selection guide, not a comprehensive feature ranking.
When comparing platforms, look beyond whether the software is described as free or open source. Verify the edition, licensing terms, deployment requirements, available integrations, and support arrangements.
Also consider whether the platform provides the reporting and embedding capabilities you need directly or whether you will need to develop integrations or introduce additional products.
For example, a team focused primarily on internal dashboards may have different requirements from a software vendor that needs customer-facing analytics, tenant-specific access controls, and multi-page document reporting.
Helical Insight is worth evaluating when these requirements need to be considered together.
10. Who Should Consider Helical Insight?
Helical Insight may be relevant to several types of organizations.
Businesses looking to evaluate alternatives to Tableau
Organizations reviewing BI expenditure can assess whether Helical Insight's Community Edition meets their functional requirements and operating constraints.
SaaS companies building analytics into their products
Software vendors can investigate its embedded analytics and API capabilities for delivering reporting experiences within their applications.
Enterprises with both dashboards and formal reports
Organizations that manage interactive analytics alongside invoices, statements, financial reports, or other structured documents can evaluate the advantages of a combined BI and reporting environment.
Teams exploring AI-assisted analytics
Businesses interested in natural-language data exploration can assess Instant BI and supported LLM integrations using representative questions and approved datasets.
Organizations preferring greater deployment control
Teams with on-premises infrastructure or specific hosting requirements can examine the supported deployment architecture and determine whether it meets their operational and security needs.
Helical Insight will not automatically be the best fit for every Tableau deployment. Organizations with specialized visualization requirements, extensive proprietary calculations, or deeply integrated Tableau workflows should conduct a structured proof of concept before deciding.
11. How to Evaluate Helical Insight Before Making a Decision
A practical evaluation should answer five questions.
1. Can it reproduce your essential analytical workflows?
Test your most frequently used dashboards, calculations, filters, drill-down paths, and data connections.
2. Can business users work independently?
Ask non-technical users to perform common tasks, such as filtering sales data, finding underperforming products, and creating basic reports.
3. Does AI analytics produce reliable answers?
Test Instant BI against questions with known results. Examine how it handles ambiguous questions, unavailable data, and permission restrictions.
4. Can it deliver the documents your business needs?
Use actual examples of invoices, financial statements, and multi-page reports to test formatting and export requirements.
5. Does the operating model fit your organization?
Review infrastructure, upgrades, security, authentication, monitoring, support, integrations, and the total cost of operating the platform.
Document the results of these tests and compare them with your current Tableau environment. This provides a stronger basis for decision-making than choosing a product solely on licensing or a feature checklist.
Frequently Asked Questions
1. What is a free, open-source alternative to Tableau?
Helical Insight is one option for organizations seeking a free, open-source business intelligence platform. It combines interactive dashboards, self-service reporting, AI-assisted analytics, embedded BI, and canned reporting. Its suitability depends on the organization's technical and business requirements.
2. Is Helical Insight free to use?
Helical Insight offers a free, open-source Community Edition. According to its product information, the full feature set is available in this edition, with commercial support and branding being principal differences from the Enterprise Edition. Review the current licensing terms before deployment.
3. Does Helical Insight support AI-powered business intelligence?
Yes. Its Instant BI module provides conversational analytics for connected business data, with analytical results depending on the configured integration and available data. It also supports a Bring Your Own LLM approach using supported language models.
4. Can Helical Insight replace Tableau for dashboarding?
It may be suitable for organizations whose requirements align with its dashboarding, visualization, filtering, and analytical interaction capabilities. However, Tableau workbooks and their calculations should be tested individually because feature behavior and implementation methods can differ between platforms.
5. Does Helical Insight support embedded analytics?
Yes. Helical Insight offers embedded analytics and APIs for integrating BI capabilities into other applications. Organizations should evaluate authentication, permissions, data isolation, branding, and the licensing requirements associated with their intended deployment.
6. Can Helical Insight generate pixel-perfect reports?
Yes. The Canned Reporting module is designed for formatted, multi-page documents such as invoices, financial statements, and operational reports. Specific formatting, pagination, and export requirements should be validated with representative documents.
7. Can organizations migrate from Tableau to Helical Insight?
A migration can be planned around existing workbooks, data connections, calculations, and dashboard workflows. Helical Insight's team offers automated migration utilities intended to reduce repetitive work. Actual compatibility and effort depend on the source environment and the reports involved.
8. Does Helical Insight support self-hosted BI deployment?
Helical Insight supports self-hosted deployment options, including on-premises environments. Organizations should verify the current supported configurations and assess infrastructure, security, maintenance, and integration requirements before deployment.
9. Is Helical Insight suitable for SaaS companies?
It is worth evaluating for SaaS companies that need embedded dashboards, reporting, and analytics within their products. The implementation should be assessed for tenant isolation, access control, scalability, customization, and commercial requirements.
10. How does Helical Insight differ from dashboard-only BI solutions?
Helical Insight combines dashboards and interactive analysis with conversational analytics, embedded BI, and a dedicated Canned Reporting module. This combination may be useful to organizations that need both exploratory analytics and structured business documents within one platform.
Conclusion: Build a More Flexible Business Intelligence Environment
Choosing a Tableau alternative is an opportunity to reassess how an organization creates, distributes, and consumes business intelligence.
Lower software licensing costs may be one motivation, but the broader decision should account for analytical workflows, reporting requirements, AI integration, embedded applications, deployment flexibility, and operational overhead.
Helical Insight brings these considerations together in a free, open-source BI platform that supports interactive dashboards, self-service analytics, Instant BI with supported LLM integrations, embedded analytics, and pixel-perfect canned reporting.
For organizations that need more than visualization alone, this combination offers a practical starting point for evaluating a different approach to business intelligence.
The best next step is to test Helical Insight against your own data, reports, and security requirements rather than relying solely on a product comparison.
Explore Helical Insight: https://www.helicalinsight.com/
Explore the Community Edition: Visit the official Helical Insight website to review the current Community Edition, licensing information, documentation, and available deployment options.
Considering a Tableau migration? Contact the Helical Insight team to discuss your existing dashboards, reporting requirements, and the applicability of available migration utilities.
Helical Insight: Open-source business intelligence for dashboards, AI-assisted analytics, embedded BI, and structured reporting.
Explore Helical Insight
Visit https://www.helicalinsight.com/ to review product information, documentation, and Community Edition details.