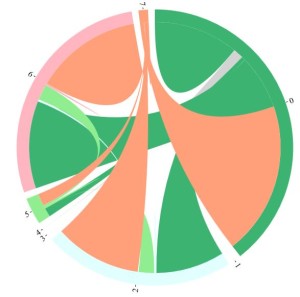
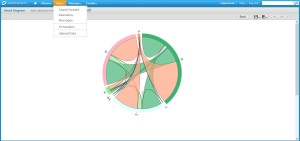
There can be different methods of integrating a D3 chart inside Jasper like using iFrame, using HTML etc. Below we will try to learn in detail how to do integration of D3 chart using HTML component integration.
What is D3 Charting? D3.js is a JavaScript library for manipulating documents based on data. D3 helps you bring data to life using HTML, SVG and CSS. D3’s emphasis on web standards gives you full capabilities of modern browsers without tying yourself to a proprietary framework, combining powerful visualization components and a data-driven approach to DOM manipulation. So D3 can be used in the HTML component of the Jaspersoft to create different types of visualization like charts, graphs, tables, etc.
Few things should be kept in mind:
- The HTML component of Jasper soft accepts codes without any delimiters like \n,\r, etc. So the complete HTML code should be converted accordingly. Moreover as the component definition is contained in “<html>………</html>”, all special characters like “, ‘, etc. should be replaced with \”, \’, etc.
2. The output of database query can also be passed to the script in the HTML component making the reports dynamic.
3. The html content expression can also access the variables and parameters defined in your report.
Suppose we have a variable name variable1 in iReport which is to be used in the html component. It can be used in the html component as shown below:
“<body><script>var =”+ $V{variable1}+”</script></body>”
4. Keep in mind that in the HTML content expression of HTML component you do not need to include the html tag, you only need to add the script, body, head, etc. tag which you are using.
Ex:
<!DOCTYPE html>
<html>
<body style=”background-color:yellow;”>
<h2 style=”background-color:red;”>This is a heading</h2>
</body>
</html>
In HTML component expression of iReport it would be written in the below format.
“<body style=\”background-color:yellow;\”><h2 style=\”background-color:red;\”>This is a heading</h2></body>”
5. Check whether sql jar (the database server you are using for your application) file is available with Jasper soft or not. By default it is not available. Download the jar file from internet and import the jar file in your application by going to the Tool ->Option. In the option menu, go to the classpath tab and click on add jar. Give the location of the jar file you downloaded.
Also make sure that the html component jar file is also present in the iReport<version>/iReport/modules/ext with name of jasperreports-htmlcomponent-<version>. If it is not present then download it and paste it in the same folder. (By default it is present. But check it.)

Best Open Source Business Intelligence Software Helical Insight is Here


In Jasper studio , I have
* Added the D3.js code to the source code of the report
* Added D3.js Jar file as external jar file and compiled the D3.js code
* The code got compiled successfully but the D3 charts are not getting displayed.
Could you please let me know where i am going wrong
This may be in issue with the browser used by you. D3JS has certain compatibility issues. Try and check it on IE9.
The way to remove this dependency would be iFrames.
I’ve got everything working except the step 2. ” The output of database query can also be passed to the script in the HTML component making the reports dynamic.”. Can you please say few more words about this step. Thank you in advance.
Hi, How I can add this html into jasper report. I mean where to add this?