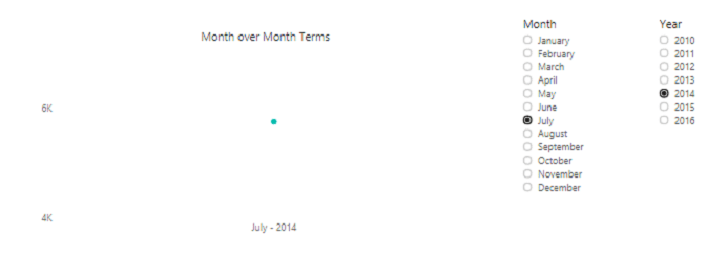
Requirement: In the Power BI report I have a Date dimension and Employee fact tables. In report I have added single select month slicer, year slicer and a line chart which should show month wise employee terminations count. Current report will look like below
Make data easy with Helical Insight.
Helical Insight is the world’s best open source business intelligence tool.

As month is single select, Month over Month terms chart is showing data for the only selected month. But I want the last 3 months data along with the selected month in Month over Month terms chart
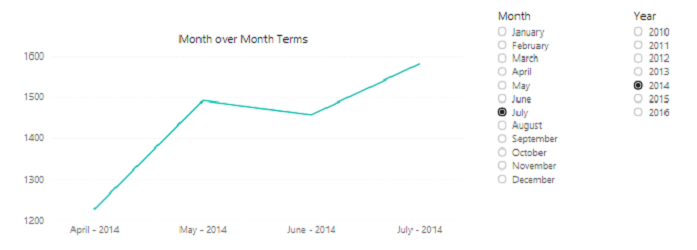
Ex: In the above image, month July is selected so chart should show data for April, May, June and July months
Solution:
- In the Power BI report we have Date dimension and Employee fact tables.
- Date dimension and Employee fact table are related with a date column
- In Date dimension we have a new column which is combination of both year and month in Month – Year format
- In Employee fact we have term column which will give the termination status of the employee
- Go to Employee fact table
- Click on create new measure
- Enter below expression
- In the above expression, we are calculating the total terms between the two date values
- As per the requirement we have to show last 3 months data along with selected month so I have used number 4 in the expression. (Based on user requirement change that value)
- Use the measure created above in the chart
- Now the chart will look like below
Measure Terms = CALCULATE(SUM(Employee[term]), DATESINPERIOD('Date'[Date].[Date], MAX('Date'[Date].[Date]), -4, MONTH))
Make data easy with Helical Insight.
Helical Insight is the world’s best open source business intelligence tool.

Thank You
Ramu Vudugula
BI Developer
Helical IT Solutions Pvt Ltd

Best Open Source Business Intelligence Software Helical Insight Here

A Business Intelligence Framework

Best Open Source Business Intelligence Software Helical Insight is Here
